Week 6 · Module 4
China’s Money and Bond Markets
Financial Institutions and Markets · MF50004.01
Prof. Jiajun Jiang · School of Economics, Fudan University · Fall 2026
Where we left off
We have studied policy rates, settlement and bond valuation. The question now is how China’s market institutions transmit funding conditions and allocate credit.
How does the money market transmit policy? What does bond-market segmentation change? How do local-government support, ratings and defaults affect credit pricing?
This lecture
| Unit | Main questions | Time |
|---|---|---|
| 1 · Money markets | Market development, liberalisation and monetary transmission | 45 min |
| 2 · Bond markets | Segmentation and local-government debt | 50 min |
| 3 · Corporate credit | Ratings, default history and market effects | 40 min |
Why institutions use short-term funding
Money markets provide short-term funding, usually for up to one year.
| Borrower | Cash is needed for… | Cash arrives from… |
|---|---|---|
| Bank | Outgoing payments | Incoming deposits or repayments |
| Securities dealer | Buying bonds for inventory | Selling those bonds |
| Company | Wages and supplier bills | Customer payments |
Short-term borrowing covers the gap between outgoing and incoming payments.
The main instruments in China’s money market
| Contract | Debtor | Protection |
|---|---|---|
| Pledged repo | Borrower | Bonds pledged |
| Unsecured interbank loan | Borrower | Counterparty credit |
| Negotiable certificate of deposit (NCD) | Issuing bank | Bank claim |
| Commercial paper / short-term note | Company | Corporate resources |
| Bank acceptance | Accepting bank | Accepted payment obligation |
Pledged repo: borrow cash against bonds
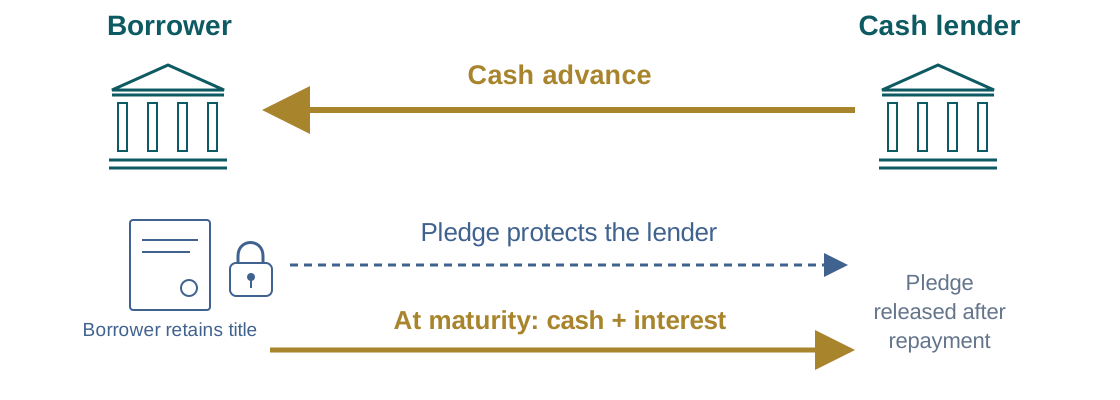
Pledged repo: title stays with the borrower. Outright repo: title transfers with an agreed reverse transaction.
The lender advances cash against an agreed value of eligible collateral.
Haircut: the collateral value excluded from funding. Illustration: RMB 100 at a 5% haircut supports RMB 95.
The reform sequence: benchmarks, bank pricing and policy signals
| Date | Development | Role |
|---|---|---|
| 1996–97 | Interbank lending and repo rates liberalised | Market pricing of wholesale funds |
| 2007 | Shibor launched | Quoted unsecured benchmark |
| 2013–15 | General loan floor and deposit ceiling removed | More freedom in customer pricing |
| 2019 | Loan Prime Rate (LPR) mechanism reformed | Link loan pricing to funding conditions |
| 2024 | Seven-day reverse-repo operation rate clarified as the main policy rate | A clearer central-bank price signal |
PBoC benchmark-reform account(2020); monetary-policy reports; Pan Gongsheng(2024,2026).
Bank and nonbank funding access
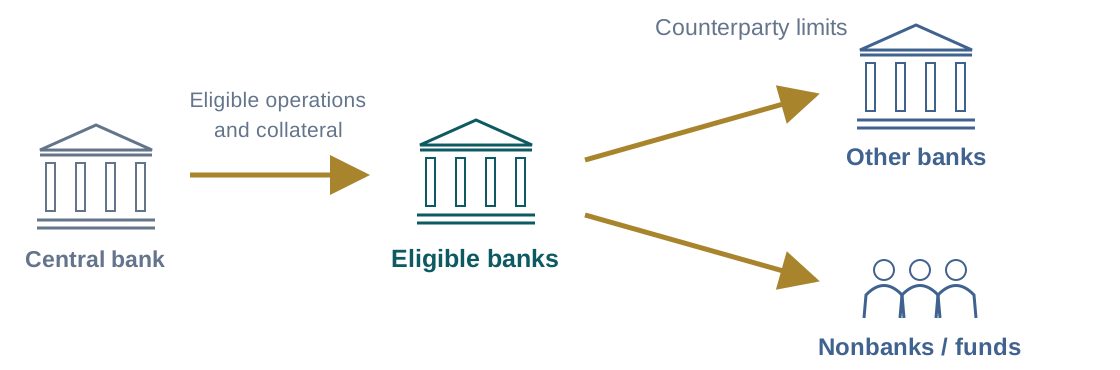
A lender’s credit limit and collateral requirements determine access to its funding.
The policy rate and the traded market rates
| Rate | Who determines it? | What it measures or does |
|---|---|---|
| 7-day reverse-repo operation rate | PBoC | Price on central-bank operations; main policy-rate role |
| DR007 | Actual seven-day secured trades | Depository-institution funding against specified collateral |
| DR001 | Actual overnight secured trades | Overnight depository-institution funding |
| Shibor | Panel-bank quotations | Unsecured funding benchmark at several maturities |
| R007 | Broader seven-day secured trades | A wider participant and collateral pool |
PBoC benchmark-reform paper(2020); RBA(2024); Pan Gongsheng,19 October 2026.
Repo and unsecured interbank lending
Average daily turnover · September 2026 · RMB trillion
22.2× repo turnover relative to unsecured interbank lending
The same cash can finance successive transactions during the month.
PBoC, September 2026 Financial Market Report, reproduced by CNAFC on27 October 2026. Daily turnover, RMB trillion.
Wholesale funding changes a bank’s incentives
| Funding source | Who supplies it? | Consequence for the bank |
|---|---|---|
| Customer deposits | Households and firms | Customer relationships and deposit competition matter |
| Interbank borrowing and repo | Eligible banks and other institutions | Funding responds to counterparty limits and market conditions |
| Negotiable certificates of deposit | Institutional investors, including funds | A market price and a date for repayment or refinancing |
Market funding can strengthen price transmission while increasing exposure to refinancing conditions.
PBoC NCD rules; Ji, Zhang, Niu & Ma, PBC Working Paper 2016/4. Research findings are the authors’ views.
China’s money funds and the rise of Yu’e Bao
| Date | Milestone | Why it matters |
|---|---|---|
| 2003 | China’s first money market fund: HuaAn Cash Fuli | The investment product predates payment apps |
| 2013 | Yu’e Bao connects Alipay users to Tianhong Zenglibao | Small retail balances gain convenient fund access |
| 2018 | Yu’e Bao adds other fund managers | The distribution platform becomes broader than one fund |
Household deposits can return to banks as institutional fund investments.
HuaAn(2004); Tianhong 2013 annual report; Ant Group 2020 prospectus.
What the 2013 cash squeeze revealed
20 June 2013 · overnight Shibor
13.44%Seasonal cash needs, slower foreign-exchange inflows and short-term funding of longer-lived assets.
Predictable operations, liquidity distribution and communication matter for rate control.
BIS, September 2013; PBoC reports; Bank of Chongqing 2013 prospectus.
Policy rates and market targets: the U.S. and China
| United States | China | |
|---|---|---|
| Policy decision | Target range for overnight federal funds | 7-day reverse-repo operation rate |
| Observed market rate | Effective federal funds rate (EFFR) | DR007 historically; DR001 increasingly central |
| Underlying market | Unsecured overnight funding | Secured repo funding |
| Implementation | Administered rates, especially interest on reserve balances (IORB) | Liquidity operations and interest-rate management |
Pan described DR001 as the de facto operating target. Main policy operations still had seven-day maturities; an overnight switch was under study.
Federal Reserve and New York Fed; RBA(2024); Pan Gongsheng,19 October 2026.
Unit 2 · 50 minutes
Bond-market segmentation and local-government debt
Products, market size, trading, implicit guarantees and debt resolution
Why China developed two bond-market segments
1997: banks redirected to the interbank market ·2010: exchange cash-bond pilots ·2019: broader bank access
| Product | Interbank | Exchange |
|---|---|---|
| Government and selected financial bonds | Major institutional market | Eligible issues also trade here |
| MTNs, CP/SCP and private placement notes | Non-financial enterprise debt-financing instruments | Interbank products; exchange debt uses separate instruments |
| Company bonds and convertibles | Primarily exchange-market products | Core exchange products |
| Enterprise bonds | Can retain trading here | Can retain trading here |
MTN: medium-term note · CP/SCP: commercial paper / super-short-term commercial paper · CSRC: China Securities Regulatory Commission
Enterprise-bond applications: exchange review and CSRC registration. Trading can still span both segments.
Handbook(2020),ch.5; NAFMII history; CSRC bank-access and enterprise-bond notices.
The product mix differs across the two segments
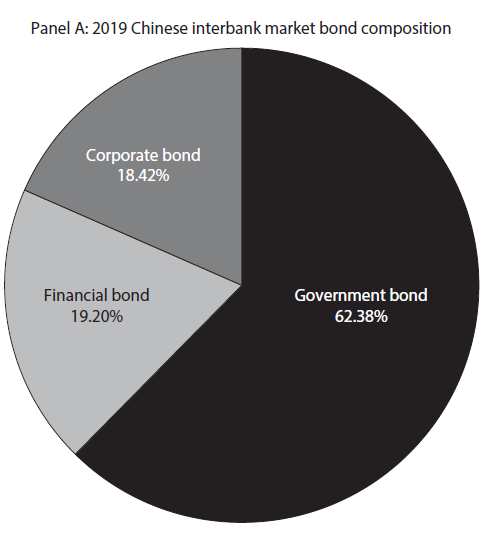
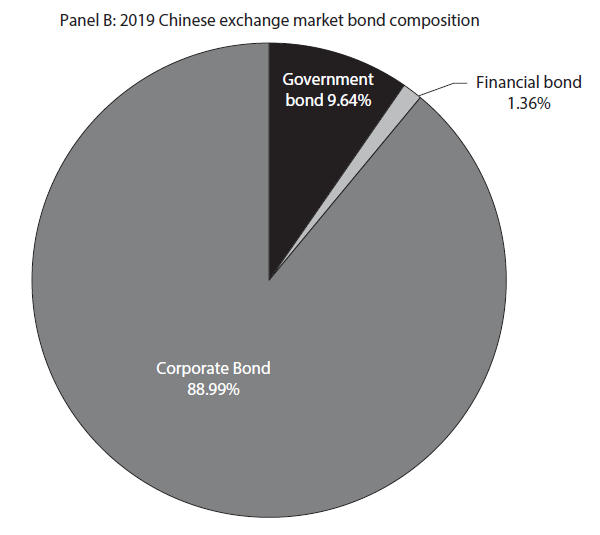
The interbank portfolio was government-heavy; the exchange portfolio was corporate-heavy.
Historical snapshot:31 December 2019. Handbook(2020),Fig.5.4; CCDC,SHCH,ChinaClear.
Market size, turnover and trading frequency
| November 2025 | Interbank | Exchange |
|---|---|---|
| Month-end bonds in custody · RMB tn | 173.0 | 23.2 |
| Cash-bond trading during the month · RMB tn | 30.5 | 3.8 |
| Trading ÷ month-end custody · rough monthly activity ratio | 17.6% | 16.4% |
How often trades occur, and how many bonds trade.
How much can be traded promptly, at what spread and price impact.
The ratios are close. This snapshot does not establish higher exchange turnover.
PBoC,November 2025 Financial Market Report. Historical trading-pattern discussion:Handbook(2020),Fig.5.5 and Table5.3.
Why a price gap can persist across markets
U.S. corporate bonds also trade mainly over the counter. China’s two main segments combine distinct participation, custody and collateral arrangements, creating additional barriers to cross-market trading.
Cross-market arbitrage requires access, funding and an executable transfer.
Handbook(2020),ch.5; Chen etal.(2023); FINRA. Price example is illustrative.
Losing repo eligibility raises the yield investors require
The bond keeps the same promised payments but loses a financing use. Investors pay less for it, so its yield rises.
| Illustration: RMB 100 collateral value | Cash that can be borrowed |
|---|---|
| 0% haircut | RMB 100 |
| 100% haircut | RMB 0 |
Published estimate: 39–85bp higher yields for a normalised 0%→100% haircut increase.
China,December 2014: selected AA+/AA bonds lost exchange repo eligibility; the same bonds also traded in the interbank market.
Chen,Chen,He,Liu & Xie(2023),Journal of Finance. Published normalised estimate; arithmetic illustration.
Local bonds are the larger part of government bond financing
Government bonds in custody · end-November 2025 · RMB trillion
57.5% Local share of central + local government bonds
Latest local-government debt: RMB 60.7tn at end-September 2026, including RMB 60.5tn of bonds. This later total has a different date.
PBoC, November 2025 financial-market report; Ministry of Finance, September 2026 debt report.
Why local governments financed projects through companies
| Financing pressure | Institutional response |
|---|---|
| Infrastructure responsibilities exceeded available budget resources | A local government established a financing vehicle (LGFV) |
| Direct government borrowing was tightly restricted | The company borrowed from banks and bond investors |
| Projects needed assets and expected repayment resources | Land-use rights, public assets and fiscal support backed financing |
| Investment expanded after the global financial crisis | Borrowing grew faster than many projects’ operating cash flows |
A project can have high public value while generating little cash for its creditors.
Handbook (2020), Ch. 8; Budget Law (1994); State Council document No. 43 (2014).
Expected public support links local debt to bank balance sheets
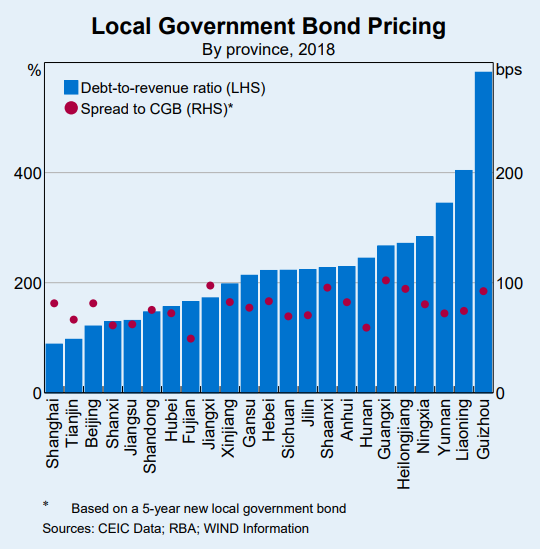
- Government bonds: fiscal burdens and observed spreads differ across provinces
- LGFV borrowing: investors assess project cash flow and expected public support
- Banks: large exposures connect local repayment stress to the financial system
Expected support affects financing costs; the legal borrower determines the contractual claim.
Historical 2018 figure: CEIC, RBA, Wind, via original Lecture 8; Handbook, Ch. 8.
Why replace old local debt with government bonds?
Buy provincial bonds
Uses proceeds for eligible old debt
Receive repayment
| Before replacement | After replacement |
|---|---|
| Bank loans and other eligible obligations; near-term repayments | Explicit government bonds; longer repayment schedule |
| Higher financing costs and opaque fiscal exposure | Potential interest savings and clearer budget recognition |
| Existing principal is owed to old creditors | Principal remains owed to the new bond investors |
Refinancing creates time and cash-flow relief. Future fiscal resources still have to service the debt.
Ministry of Finance, debt-replacement explanations (2015, 2019, 2024).
Two rounds of replacement addressed different debt stocks
2015–18: RMB 12.2tn issued for non-bond obligations recognised as government debt at end-2014.
November 2024 design: RMB 6tn of new debt limits + RMB 4tn from special-bond allocations. The chart shows the announced schedule.
Ministry of Finance, 2019 reply and 8 November 2024 debt-resolution announcement.
The euro-area crisis and China’s local debt: a comparison
| Dimension | China’s local debt | Euro-area debt crisis |
|---|---|---|
| Currency and fiscal authority | One national fiscal state; local governments cannot issue currency | Common currency and ECB; national fiscal authorities |
| Debtors and banks | Provincial governments and separate LGFV companies; bank exposure | National sovereigns and banks; stress passed in both directions |
| Debt treatment | Eligible old obligations refinanced with explicit local bonds | Official loans and maturity relief; Greek private-creditor haircuts |
| Institutional response | Debt limits, budget recognition and controls on new hidden debt | Conditional assistance; central-bank backstop; stronger bank oversight |
European response: EFSF/ESM assistance · Greek restructuring (2012) · ECB’s OMT commitment (2012, unused) · banking union.
ESM, programme and restructuring records; ECB, OMT decision (2012) and subsequent assessments.
What, if anything, can China learn from Europe’s response?
Open discussion · 6 minutes
Which European response could help address China’s local-government debt problem? What would have to change for it to work?- Identify the problem the response would address.
- Explain who provides funding or bears losses.
- Identify a Chinese institution that helps or limits its use.
You may argue for a useful lesson, a modified approach, or limited applicability.
Unit 3 · 40 minutes
Credit ratings, defaults and market discipline
Rating information, default history and the repricing of support
What does a credit rating tell the investor?
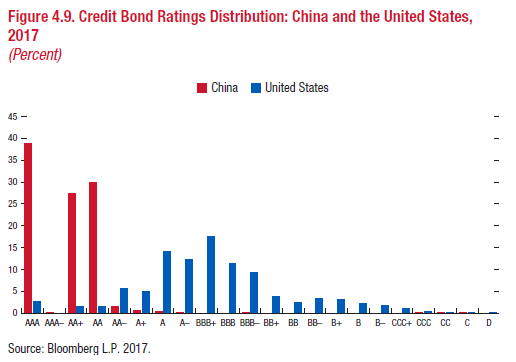
- A relative assessment, not a guaranteed payment
- Depends on the rating scale and assessed support
- A cluster at the top leaves little differentiation within that cluster
The same rating symbol need not represent the same risk across domestic and global scales.
Historical comparison: 2017. IMF (2019), Fig. 4.9; Bloomberg L.P.; Jiang & Packer (2017).
High domestic ratings still contain information
Issuer selection, support expectations, investor eligibility and rating-agency incentives shape the distribution.
Both domestic and global ratings were reflected in bond prices, despite their different scales.
Default prediction requires a separate test: ratings before distress, subsequent missed payments and downgrade lead times.
Ratings can contain information while leaving important risks unresolved.
Jiang & Packer (2017), BIS Working Paper 648; Handbook (2020), ch. 5.
China’s default history: five changes in expectations
| Episode | What creditors learned |
|---|---|
| 2014 · Chaori Solar | A publicly issued onshore corporate bond can miss payment |
| 2015 · Baoding Tianwei | State ownership does not ensure timely payment |
| 2018–19 · Private-sector wave | Refinancing conditions can expose weak issuers |
| 2020 · Yongcheng and other SOEs | High domestic ratings and support expectations need reassessment |
| 2021 onward · Property stress | Sector-wide funding problems reach offshore as well as onshore claims |
A missed payment, a restructuring and an eventual recovery are different events.
Issuer disclosures and rating-agency records; Handbook (2020), ch. 5; Geng & Pan (2024).
Recent defaults: fewer new issuers than in 2020–21
First substantive-default issuers · domestic bonds · annual count
2026 Jan–Sep update, separate Pengyuan definition: 16 credit-risk bonds = 10 extensions + 5 substantive defaults + 1 waived covenant event.
Lianhe, 2025 annual review, Fig. 1.1 (2020–23 counts read from bars); Pengyuan, 22 October 2026.
Private firms account for most new defaulting issuers in 2025
13 first substantive-default issuers · domestic bonds · Lianhe classification
| Private enterprises | State-owned enterprises | Other ownership categories |
|---|---|---|
| 9 issuers · 69.2% | 0 issuers · 0% | 4 issuers · 30.8% |
Other = foreign-owned and public-company categories in the source. “Public company” here does not mean state ownership.
Composition of defaults is different from the default probability within each ownership group.
Lianhe, 2025 annual review, ownership discussion; issuer counts, not bond counts or debt amounts.
The SOE credit-spread advantage widened in 2018
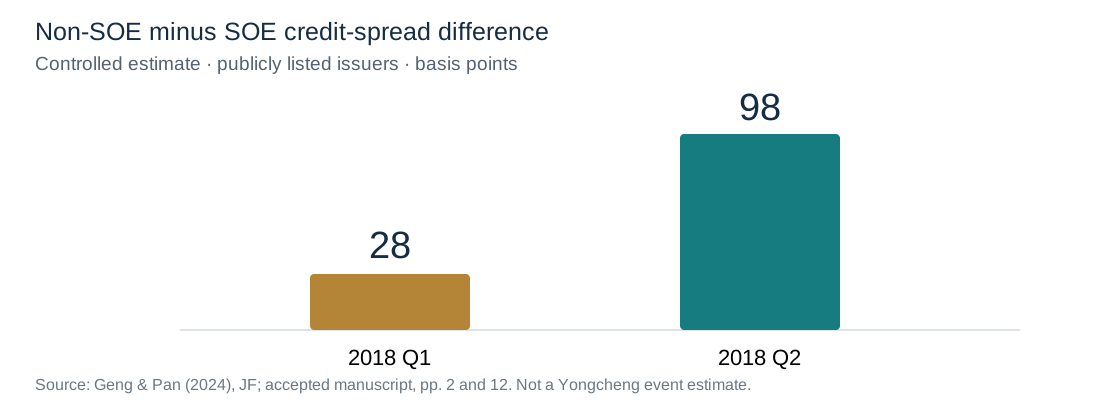
Liquidity pressure can widen the value of an expected backstop even when its strength does not change.
Geng & Pan (2024), Journal of Finance 79(5), 3041–3103; accepted manuscript, pp. 2 and 12.
LGFV debt stress can appear outside the public bond market
Zunyi Road and Bridge · December 2022RMB 15.594bn of bank loans restructured
New schedule20 years: interest-only for the first 10, principal repaid over the next 10
Public bondsExplicitly excluded from this restructuring
| Instrument | What establishes the event? |
|---|---|
| Bank-loan restructuring | Zunyi: principal repayments shifted into the future |
| Financing-lease payment default | Shuicheng Water: missed payments from 2021; local urban-investment guarantor faced enforcement |
| Public-bond payment default | Neither example establishes a missed public-bond payment |
Pengyuan notices filed with SSE: 17 January 2023 (Zunyi); 1 November 2022 (Shuicheng).
Yongcheng: AAA rating, state ownership and default
Before defaultHenan SOE; rated AAA before the event
10 November 2020RMB 1bn, 270-day note missed principal and interest at maturity
2021 investigationParent-controlled receivables had been classified as cash
Check accessible issuer cash, refinancing needs and the evidence behind expected support.
Lead underwriters (November 2020); Lianhe rating-action record; CSRC Administrative Decision No. 44 (2021).
Main takeaways
| Institutional feature | Why it matters |
|---|---|
| Bank-centred money markets | Access and collateral shape funding and monetary transmission |
| Two bond-market segments | Trading and collateral rules can sustain price differences |
| Local government and LGFV borrowing | Legal obligations, fiscal resources and expected support differ |
| Debt resolution | Refinancing, loss allocation and future borrowing incentives require separate analysis |
| Ratings and defaults | Use the rating scale, event definition and issuer cash flows together |
Before Next Class
Mishkin & Eakins, Chapter 13: stock markets. Revisit Chapters 11–12 for the instrument definitions used here.
Handbook of China’s Financial System, Chapters4,5 and8; Chen etal.(2023) on pledgeability; Geng & Pan(2024) on support and credit pricing.
Next topic: stock markets, 2 and 5 November.
References
- Mishkin & Eakins (2018), Financial Markets and Institutions, Chapters 11–12.
- Amstad, Sun & Xiong, eds. (2020), The Handbook of China’s Financial System, Chapters 4, 5 and 8.
- PBoC, Financial Market Report, August 2026; benchmark-reform report (2020); NCD rules.
- CCDC & ICMA (2024), China’s repo market; CSRC, money-market-fund rules.
- Ministry of Finance, local-debt guidance (2016) and debt-resolution announcement (8 November 2024).
- CSRC, enterprise-bond transition (2023); Yongcheng administrative decision No. 44 (2021).
- Chen, Chen, He, Liu & Xie (2023), Journal of Finance 78(5), 2563–2620.
- Geng & Pan (2024), Journal of Finance 79(5), 3041–3103.
- Bank of Chongqing, 2013 prospectus; Yongcheng lead underwriters, November 2020 notice; CFETS, Bond Connect.
- IMF (2019), The Future of China’s Bond Market, Chapter4; original 2017 ratings and ownership figures.
- MoF, September 2026 local-government debt release; PBoC, November 2025 and September 2026 financial-market reports.
- Jiang & Packer (2017), BIS Working Paper648, domestic and global ratings in China.
- Lianhe (2026), 2025 bond-default review; Pengyuan (October 2026), January–September credit-risk review.
- ESM, conditional assistance and Greek restructuring; ECB, OMT decision (2012).
- Pengyuan, Shuicheng lease-payment/guarantee notice (2022); Zunyi bank-loan restructuring notice (2023).
Appendix
Optional reference pages
Definitions and calculation checks
Appendix: benchmark and instrument glossary
| Term | Meaning |
|---|---|
| DR007 / R007 | Transaction-weighted seven-day pledged-repo rates for different populations |
| FDR007 / FR007 | Repo fixing benchmarks; construction differs from DR/R weighted averages |
| Shibor | Panel-bank quotation benchmark for unsecured wholesale RMB funding |
| NCD | Negotiable certificate of deposit issued by an eligible bank |
| MTN / SCP | Medium-term note / super-short-term commercial paper |
| LGFV / SOE | Local government financing vehicle / state-owned enterprise |
| CGB | China government bond |
Appendix: verify the arithmetic and the measurement
| Example | Calculation | Interpretation |
|---|---|---|
| Repo/unsecured turnover | 6.5÷0.29254≈22.2 | Same daily frequency, September 2026 |
| Holding concentration | 85.3−54.2=31.1%;100−85.3=14.7% | Remaining groups in the same credit-bond population |
| Cash capacity | 100×(1−5%)=95;100×(1−10%)=90 | Hypothetical collateral/refinancing amounts, RMB million |
| Price and haircut change | 98×(1−10%)=88.2;95−88.2=6.8 | Optional combined shock, RMB million |
| Annual interest saving | 100×(6%−3%)=3 | Illustration, RMB million; principal remains 100 |
Appendix: a short international instrument comparison
| General instrument | Useful comparison | Limit of the analogy |
|---|---|---|
| Treasury bill | Short-term sovereign financing | Issuance and investor arrangements differ by country |
| Repo | Collateral-supported short-term funding | Title transfer and pledged structures differ |
| Negotiable bank certificate | Tradable bank funding claim | Eligibility, tenor and protections follow local rules |
| Commercial paper | Short-term corporate funding | Legal product categories and maturities differ |
| Municipal/subnational bond | Borrowing below the central-government level | US tax and federal arrangements cannot be transplanted to China |
Appendix: Who issues China’s corporate credit?
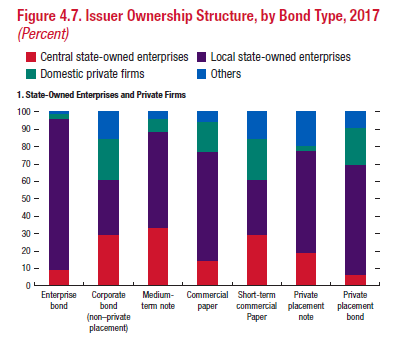
- State-owned enterprises (SOEs) were prominent across several product categories
- Private issuers also used company bonds and financing notes
- Ownership affects expected support and refinancing access
State-owned issuers dominated many product categories; the product label itself did not determine ownership.
Historical snapshot: 2017. IMF (2019), Fig. 4.7; Bloomberg L.P.; original Lecture 8 figure.
Appendix: Defaults rose sharply in 2018–19
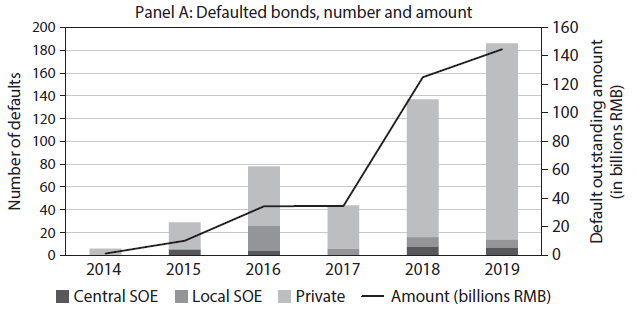
Bars count defaulted bonds. The line measures principal amount, in RMB billions. Neither is an issuer default probability.
Historical series: 2014–2019. Handbook (2020), Fig. 5.8, Panel A; Wind.