Week 7 · Module 4
Stock Markets
Financial Institutions and Markets · MF50004.01
Prof. Jiajun Jiang · School of Economics, Fudan University · 2 and 5 November 2026
From repayment promises to ownership claims
Bond investors evaluated legal borrowers, repayment resources and expected support.
Shareholders receive the residual cash flows and bear changes in the value of the business.
Four questions for this week
| Session | Question | Time |
|---|---|---|
| 1 · Equity and valuation | What determines the return an investor earns? | 45 min |
| 2 · China’s listing institutions | How do entry, ownership and exit rules shape listed firms? | 45 min |
| 3 · Onshore and offshore markets | What changes when a Chinese company lists in another market? | 45 min |
| 4 · The performance question | Why have economic growth and investor returns diverged? | 45 min |
Shareholders’ cash-flow rights and voting power
| Common shares | Preferred shares |
|---|---|
| Usually voting rights; a residual claim | Priority over common shares; rights specified in the contract |
| Dividends depend on company decisions | Rank behind creditors |
Control over investment and distributions affects the value received by outside shareholders.
New issuance raises capital; secondary trading changes owners
A rising market capitalisation can reflect new issuance as well as gains on existing shares.
How shares reach investors and trade
| Function | Institutional role | Examples |
|---|---|---|
| Listing | Admit issuers and enforce continuing disclosure | Shanghai, Shenzhen, Hong Kong, NYSE, Nasdaq |
| Order matching | Match compatible buy and sell orders | Exchange order books and electronic trading systems |
| Market making | Quote buying and selling prices and hold inventory | Dealers operating on or away from exchanges |
The trading mechanism determines how investors obtain liquidity and what it costs.
Mishkin, Ch. 13; SEC, exchange registration and market-participant guidance.
Order size affects the execution price
| Sell orders | Price | Shares offered |
|---|---|---|
| Best ask | 10.02 | 100 |
| Next ask | 10.05 | 300 |
| Buy instruction | What happens in this simplified book? |
|---|---|
| Market order for 200 shares | 100 at 10.02, then 100 at 10.05 |
| Limit order: buy 200 at no more than 10.02 | Up to 100 immediately; the rest may remain unfilled |
Hypothetical snapshot. Quotes and available quantities can change before execution.
Execution cost depends on quantity and available liquidity as well as the quoted spread.
SEC investor guidance; hypothetical order book.
Total returns include price changes and dividends
\[R_{t+1}=\frac{P_{t+1}-P_t+D_{t+1}}{P_t}\]
| One-year example | Amount |
|---|---|
| Purchase price | 100 |
| Sale price | 105 |
| Dividend received | 3 |
| Total return | 8% = 5% price gain + 3% dividend yield |
For international comparisons: also specify currency, inflation and dividend-tax treatment.
Including dividends is essential when comparing long-run investment performance.
Mishkin, Ch. 13; S&P Dow Jones Indices methodology. Example is hypothetical.
Index weights determine which companies drive the result
| Company | Price | Shares | Market value |
|---|---|---|---|
| A | 100 | 1 million | 100 million |
| B | 10 | 20 million | 200 million |
Examples: Dow Jones Industrial Average uses price weights; S&P 500 uses float-adjusted market-value weights.
S&P Dow Jones Indices methodology; hypothetical two-company illustration.
An ETF provides a tradable share in a portfolio
| ETF | Conventional open-ended index fund |
|---|---|
| Trades throughout the day at a market price | Normally dealt at the calculated net asset value (NAV) |
| Investor pays the bid–ask spread and fees | Investor pays the fund’s dealing charges and fees |
The ETF’s index and trading arrangements determine the exposure and costs.
SEC, Updated Investor Bulletin: Exchange-Traded Funds.
Dividend valuation discounts expected shareholder cash flows
\[P_0=\frac{E_0[D_1+P_1]}{1+k_e}\]
\[P_0=\sum_{t=1}^{\infty}\frac{E_0[D_t]}{(1+k_e)^t}\]
The expected resale price reflects the dividends available to subsequent shareholders.
Mishkin & Eakins, Ch. 13.
The Gordon model links value to growth and required return
\[P_0=\frac{D_1}{k_e-g},\qquad k_e>g\]
| Assumption | Worked example |
|---|---|
| Next-year dividend, D₁ | 2 per share |
| Required return, kₑ | 10% |
| Long-run dividend growth, g | 5% |
| Value | 2 ÷ (10% − 5%) = 40 |
A strong growth story can already be reflected in a high purchase price.
Mishkin & Eakins, Ch. 13; hypothetical valuation.
P/E benchmarks reflect growth, risk and payout
\[\text{Forward P/E}=\frac{P_0}{E_0[EPS_1]}=\frac{\text{payout ratio}}{k_e-g}\]
Gordon illustration: 50% dividend payout; 10% required return
| Long-run dividend growth | 3% | 5% | 7% |
|---|---|---|---|
| Forward P/E | 7.1× | 10.0× | 16.7× |
Forecast EPS = 4; forward P/E = 10×; implied price = 40.
Trailing P/E uses reported earnings; forward P/E uses forecast earnings.
A higher multiple needs support from sustainable growth, lower risk or greater distributable earnings.
Mishkin & Eakins, Ch. 13; hypothetical sensitivity analysis.
Would you buy the faster-growing company?
| Hypothetical firms in the same sector | Growth firm | Income firm |
|---|---|---|
| Market price | 60 | 40 |
| Next-year dividend | 2 | 3 |
| Long-run dividend-growth assumption | 6% | 3% |
| Required return assumed by your committee | 10% | 10% |
Discussion · 6 minutes
Your committee prefers the growth firm because its business expands faster. Would you support that choice? Identify one assumption that could reverse your recommendation.Tesla: current earnings and an AI valuation narrative
\[P_t=EPS_t\times(P/E)_t\]
Latest reported earnings · prices at 30 October 2026
| Company | P/E | TTM profit US$bn |
|---|---|---|
| Tesla | ≈440× | 3.2 |
| Toyota | ≈9× | 27.6 |
| BYD | ≈17× | 4.7 |
TTM = trailing 12 months; profits cover each company’s business as a whole.
US$20.56bn automotive / US$28.05bn total
Autonomy · robotaxis · Optimus
Future markets, software income and margins
Translate the AI story into future customers, margins, investment needs and profits.
Tesla Q3 2026 Form 10-Q; Stock Analysis, 30 October 2026. TTM ends: Tesla/BYD September; Toyota June.
Required earnings growth under a two-stage scenario
Common required return: 10% · observed P/E inputs from 30 October 2026
| Company | Trailing P/E | Assumed payout years 1–10 | Required annual EPS growth years 1–10 |
|---|---|---|---|
| Tesla | 440× | 0% | ≈60% |
| Toyota | 9× | 32% | ≈5% |
| BYD | 17× | 10% | ≈15% |
Every firm reaches a 10.3× trailing P/E at year 10.
Illustrative two-stage dividend model; historical payout inputs from Tesla, Toyota and BYD filings.
Session 2 · 45 minutes
Ownership, entry and exit in China’s stock market
The problems behind the reforms, what changed, and what remains
China’s multi-level stock market
Larger, established businesses
Science and technology innovation
Innovative and growth businesses
Innovative small and medium-sized enterprises
Base and Innovation tiers; quotation is distinct from exchange listing.
Board design shapes the businesses and investors admitted to each market.
CSRC, IPO registration measures; SSE, SZSE and BSE market descriptions.
The split-share structure created conflicting incentives
| Owner | Trading position | Main financial incentives |
|---|---|---|
| Controlling state or corporate block | Could not trade freely on the exchange | Dividends, control and the value of the business |
| Public minority shareholders | Held the tradable float | Dividends and gains from selling at the market price |
Concentrated control · limited sensitivity to the quoted price · uncertainty over future share supply
Handbook of China’s Financial System, Ch. 11; Carpenter & Whitelaw (2017).
The 2005 reform negotiated a route to wider tradability
Listed-equity value by trading category · 1991–2016 · RMB trillion
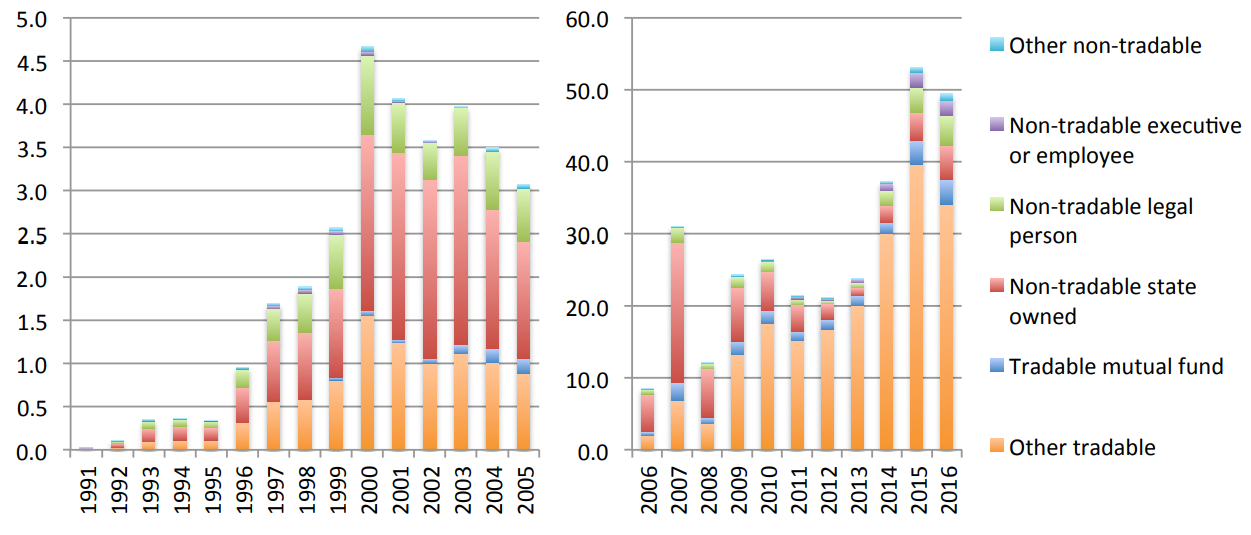
Compensation → separate approval by public holders → lockups → phased trading eligibility
Original figure: Carpenter & Whitelaw (2017), Figure 1(b); CSRC reform rules (2005).
After reform: wider tradability and mixed efficiency gains
1,032 reforming firms · values three years before and three years after reform
| Measure | Observed change | What improved? |
|---|---|---|
| Real revenue: median firm-level change | SOEs +84%; non-SOEs +57% | Business scale expanded |
| Real revenue per employee: median change | +41% in both groups | Labour productivity rose |
| Firms lending to controllers (full sample) | 42.3% → 16.6% | Related-party lending became less common |
| Expenses / sales | About +3 percentage points in both groups | Cost control weakened on this measure |
Tradability expanded; concentrated control and enforcement remained important.
Liao, Liu & Wang (2014), Tables 2–5. Descriptive reform-window changes; matched comparisons discussed in notes.
Approval-era entry combined screening, queues and pricing controls
The China Securities Regulatory Commission (CSRC) screened public offerings.
| Historical constraint | Intended role | Economic friction |
|---|---|---|
| Profitability and business review | Screen firms before they raise public money | Young, pre-profit businesses had few routes to entry |
| Queues and issuance pauses | Control admission and the pace of fundraising | Uncertain timing increased financing costs |
| Offer-price guidance in capped periods | Limit the price paid by IPO subscribers | A gap could open between the offer price and market demand |
Scarce IPO allocations could generate large initial gains; scarce listing status could acquire shell value.
Qian, Ritter & Shao (2024), institutional history and Tables 1–2.
Listing speed depends on the whole process
| Evidence | Start and end of the clock | Reported time |
|---|---|---|
| China: successful IPOs, 2014–17 | Initial filing → formal approval | Mean 489 calendar days |
| China: current review rule | Regulatory review and registration clock | Up to 3 months; specified exclusions |
| Hong Kong: 2025 applications | Acknowledgment → readiness for hearing | Median 92 business days |
| Hong Kong: same report | HKEX processing time | Median 32 business days |
Preparation, issuer responses, underwriting and the market window also affect time to listing.
Qian, Ritter & Shao (2024); SSE review rules; HKEX Listing Committee Report 2025; SEC filing guidance.
Large IPO gains could be followed by weak aftermarket returns
Historical offer-price policy episodes · Qian, Ritter & Shao (2024)
Gain from the offer price
Following three years
Initial gain (IPO underpricing): offer → first close without a binding daily limit. Later return: relative to matched seasoned stocks.
IPO allocation gains and long-run aftermarket performance answer different investment questions.
Qian, Ritter & Shao (2024), Table 4. Means; three-year figures are cumulative benchmark-relative returns.
Scarce access gave weak listed firms an option value
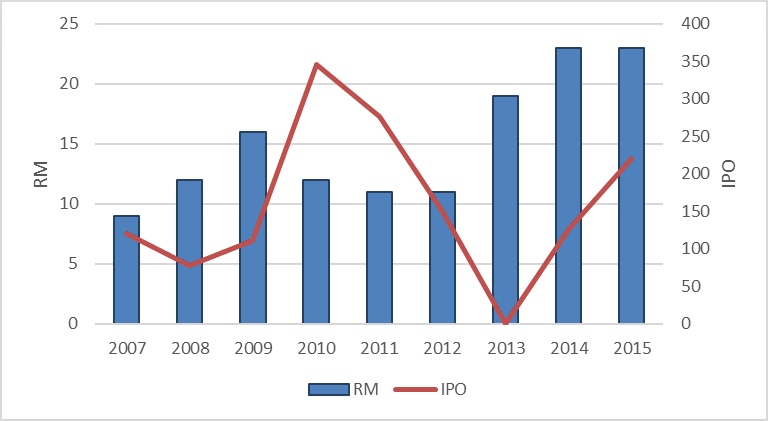
Acquire control of a listed company → inject the unlisted business → use the existing listing.
The historical chart shows 19 reverse mergers in 2013, when there were no IPOs.
Original chart: Lee, Qu & Shen (2017), VoxChina Figure 1. Shell estimate: Lee, Qu & Shen (2023).
Approval and registration distribute screening differently
| System | Admission review | Price and commercial judgement |
|---|---|---|
| China: former approval | Central regulatory review of issue conditions and business eligibility | Administrative screening and period-specific issuance/pricing controls |
| China: registration | Exchange review of eligibility, board fit and disclosure; CSRC registration | More market-based pricing, with regulatory positioning and review |
| United States | SEC disclosure review plus NYSE/Nasdaq listing standards | Issuer, underwriters and investors price the business |
| Hong Kong | HKEX eligibility and suitability review; SFC oversight | Market pricing within listing and sponsor requirements |
Registration relies more on investor choice, supported by disclosure, intermediaries and enforceable rules.
CSRC, SEC, NYSE/Nasdaq, HKEX and SFC admission rules and guidance.
Registration changed pricing, disclosure and eligible business models
| Reform channel | What changed |
|---|---|
| Review and responsibility | Exchange-led review; issuer and intermediary disclosure duties |
| Offer pricing | Earlier offer-price caps were removed; market-based inquiry and pricing gained more room |
| Eligibility | Additional routes for innovation firms, including selected unprofitable issuers |
| Continuing discipline | Disclosure enforcement, liability and exit must support investor choice |
2025–26: STAR and ChiNext further expanded routes for eligible innovative firms.
CSRC and exchange registration rules (2019–2023); STAR and ChiNext updates (2025–2026).
Reform results: higher offer prices, persistent initial premiums
| Evidence | Observed result | Interpretation |
|---|---|---|
| 2019–20 pilot comparison | Offer P/E: STAR 67.4×; Shanghai Main 21.9× | Offer prices were less constrained |
| Same pilot comparison | Initial gain: STAR 160%; Main 171% | The difference was not statistically significant |
| Shell estimate 2007–18 →2019–20 | 28.7% → 13.0% of average listed-firm value | Relative shell value fell; the listing option remained |
123 IPOs; average first-day price gain about 273% (Choice data).
Qian, Ritter & Shao (2024), Table 12; Lee, Qu & Shen (2023); Choice, 12 October 2026.
China strengthened exit rules and increased compulsory removals
| Stage | Change in the exit framework |
|---|---|
| Before the 2020 overhaul | Long suspension/resumption routes could prolong weak firms’ listing status |
| 2020 reform | Broader triggers and shorter procedures; old suspension/resumption stages removed |
| 2024 reform, carried forward in 2026 rules | Stricter financial, fraud and compliance criteria; stronger accountability |
Recent all-exit counts: 31 in 2025; 21 in January–September 2026.
CSRC and exchange exit reforms (2020,2024,2026); CSRC January 2024 briefing; CAPCO2025/2026 reports.
China and the U.S. both need credible exit and investor remedies
| Dimension | China | NYSE / Nasdaq |
|---|---|---|
| Continued-listing standards | Trading, financial, disclosure and serious-violation criteria | Price, financial/distribution, reporting and governance standards |
| Procedure | Risk warnings and trigger-specific remediation or removal | Deficiency notices, cure plans/periods and review; exceptions apply |
| After removal | Delisted-share transfer arrangements; legal claims continue | Possible OTC trading; legal claims and reporting duties considered separately |
| Investor redress | Civil claims and representative litigation alongside regulatory action | Private securities litigation and public enforcement/recovery mechanisms |
CSRC; SEC investor-recovery guidance; Nasdaq and NYSE continued-listing rules.
Two approaches to protecting investors
| Approval-centred screening | Disclosure-led registration | |
|---|---|---|
| Rationale | Regulator screens commercial eligibility for investors | Investors choose after verified disclosure |
| Potential benefit | Protection where retail expertise and private enforcement are limited | More financing choice and room for new business models |
| Main risk | Delay, lobbying, exclusion of good firms and reliance on official approval | Poorly informed choices, intermediary conflicts and losses before enforcement |
| Institutional requirement | Expert, accountable and consistent regulatory judgement | Reliable audits, capable intermediaries and effective legal remedies |
Paternalistic screening and market choice are competing rationales; real systems combine elements of both.
Institutional comparison and synthesis of the evidence in this session.
Which IPO model fits an emerging market?
Many inexperienced retail investors; innovative firms need capital; regulatory and judicial resources are limited.
Open discussion · 6 minutes
Would you lean toward approval-style business screening or disclosure-led registration? Defend your choice, identify a cost you accept, and explain what would make you change it.Consider investor capability, review quality, financing delays, reliable disclosure and enforceable rights.
Session 3 · 45 minutes
Chinese equity across listing venues
Where Chinese companies list, why they go abroad, and what investors gain and risk
Identify the issuer, the security and the trading venue
| Label | What it describes | Key distinction |
|---|---|---|
| A shares | Mainland-market RMB shares | Mainland listing route; special red-chip arrangements also exist |
| B shares | Mainland-listed foreign-currency shares | Shanghai USD / Shenzhen HKD quotation |
| H shares | Mainland-incorporated issuer listed in Hong Kong | Domicile and listing label, not a state-ownership label |
| Red chips / P chips | Offshore-incorporated China-related issuers | Conventionally state-controlled / privately controlled |
| ADR / ADS | Depositary instrument backed by issuer shares | Instrument wrapper; identify the underlying issuer |
HKEX equity descriptions; SEC depositary-receipt guidance.
Hong Kong finances mainland businesses beyond H shares
Hong Kong IPO proceeds by enterprise category · calendar 2025
HKEX Annual Report 2025; Hong Kong Financial Services and the Treasury Bureau.
Chinese companies differ across listing venues
Historical sector mix: A shares, Hong Kong-listed and U.S.-listed Chinese companies
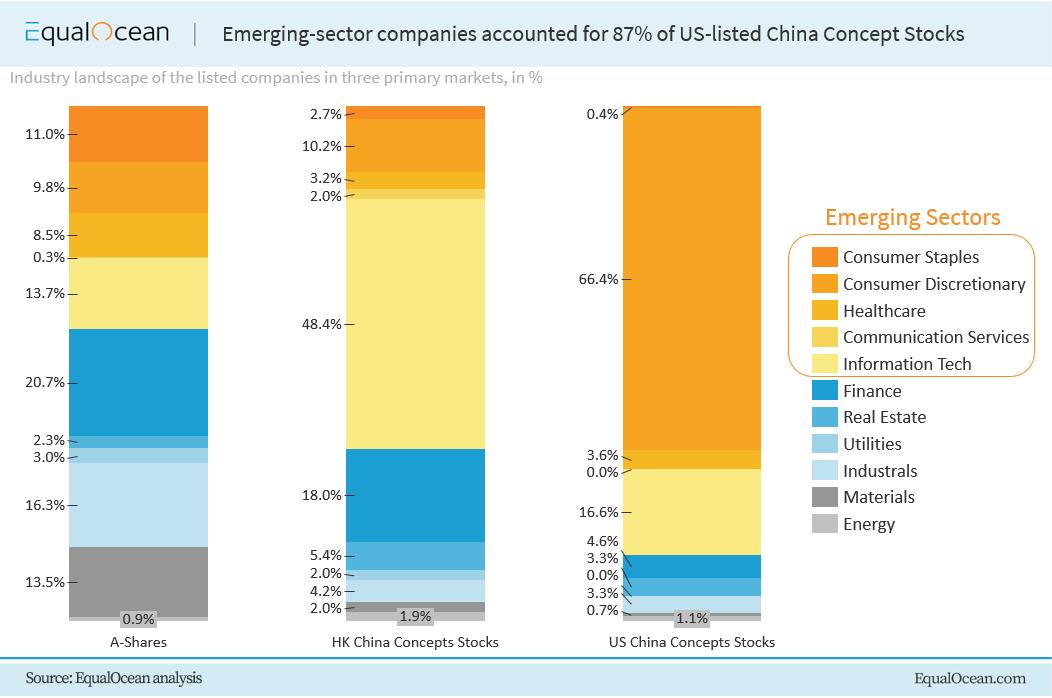
EqualOcean historical exhibit, reproduced in Lecture 9 (2024); observation date and weighting unspecified.
Why U.S. markets attracted Chinese technology firms
| Core attraction | Why it matters for a technology company |
|---|---|
| Specialist investors and liquid markets | Analysts, institutional demand and follow-on financing for growth businesses |
| Admission suited to growth companies | Alternative listing tests can accommodate firms investing ahead of profits |
| Founder control and international expansion | Eligible voting structures; listed equity for acquisitions and employee incentives |
HKEX, Weighted Voting Rights Concept Paper (2014); Qian, Ritter & Shao (2024); current listing rules.
A depositary receipt represents shares through an intermediary
Share ratio · dividend distribution · voting instructions · fees · conversion procedures
SEC, American Depositary Receipts; issuer depositary agreements.
Sina: equity ownership offshore, contractual control onshore
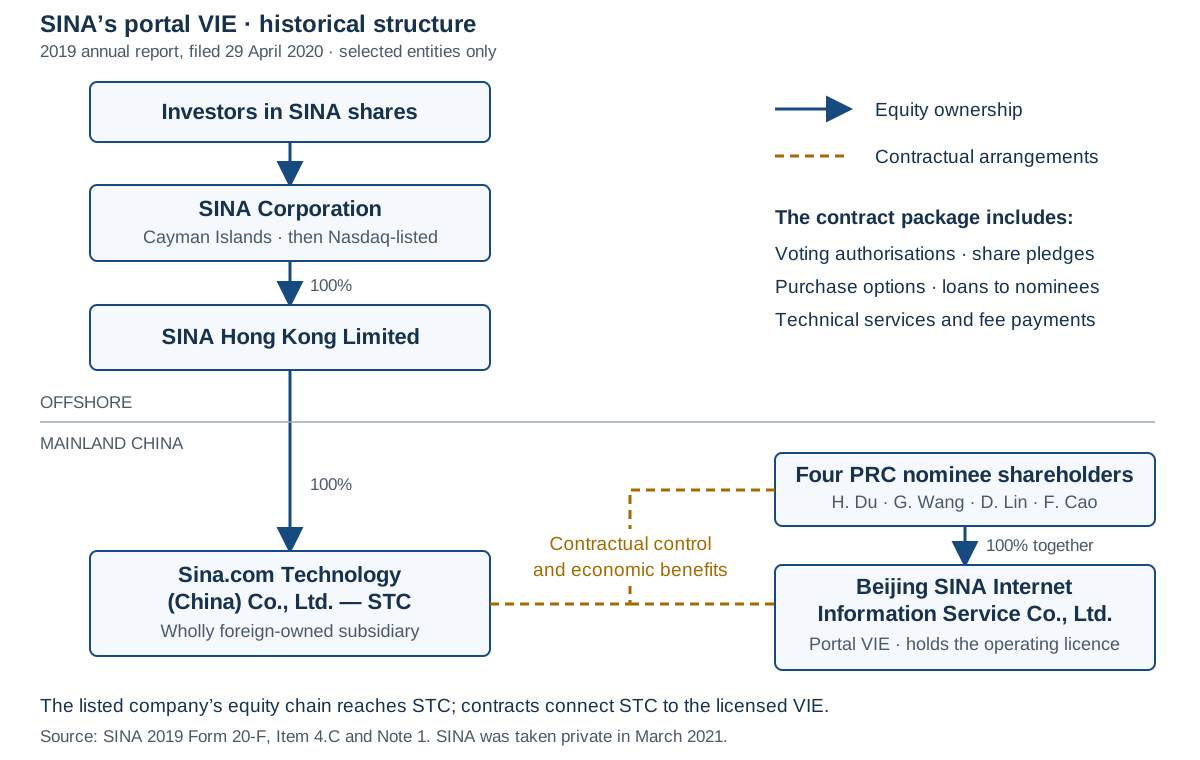
SINA 2019 Form 20-F, Item 4.C and Note 1 (filed April 2020); historical portal branch.
HFCAA risk encouraged firms to build alternative listing routes
| Development | Implication for an overseas issuer |
|---|---|
| 2020 HFCAA; issuers identified in 2022 | Audit-access conflict threatened continued U.S. trading |
| NIO · Hong Kong listing, March 2022 | May 2022 HFCAA response highlighted the second venue and share fungibility |
| December 2022 access breakthrough | PCAOB vacated adverse China/Hong Kong determinations |
| Current framework | Two consecutive identified years can trigger a U.S. trading ban; no current at-risk issuers on SEC status page |
China’s overseas-listing filing regime has applied to direct and indirect listings since March 2023.
SEC HFCAA status (checked 4 Nov 2026); PCAOB; NIO, 5 May 2022; CSRC (2023).
Alibaba illustrates an offshore issuer with two trading routes
| Date or security | What changed |
|---|---|
| 2014 · New York | ADS listing; each ADS now represents 8 ordinary shares |
| 2019 · Hong Kong | Ordinary shares listed; issuer remains incorporated in the Cayman Islands |
| 28 August 2024 | Hong Kong status converted to dual primary listing |
| 10 September 2024 | Hong Kong ordinary shares entered Stock Connect |
Alibaba’s ADSs and Hong Kong ordinary shares are convertible under the depositary arrangements.
The same issuer can offer convertible trading routes without being an A/H company.
Alibaba, 2024 announcements, investor FAQ and FY2026 annual report.
Market opening expands access through specific channels
Other channels include qualified foreign institutional investment. Index inclusion can change demand without creating new legal rights.
HKEX Stock Connect; SSE investor-suitability rules.
Foreign ownership remains low in mainland equities
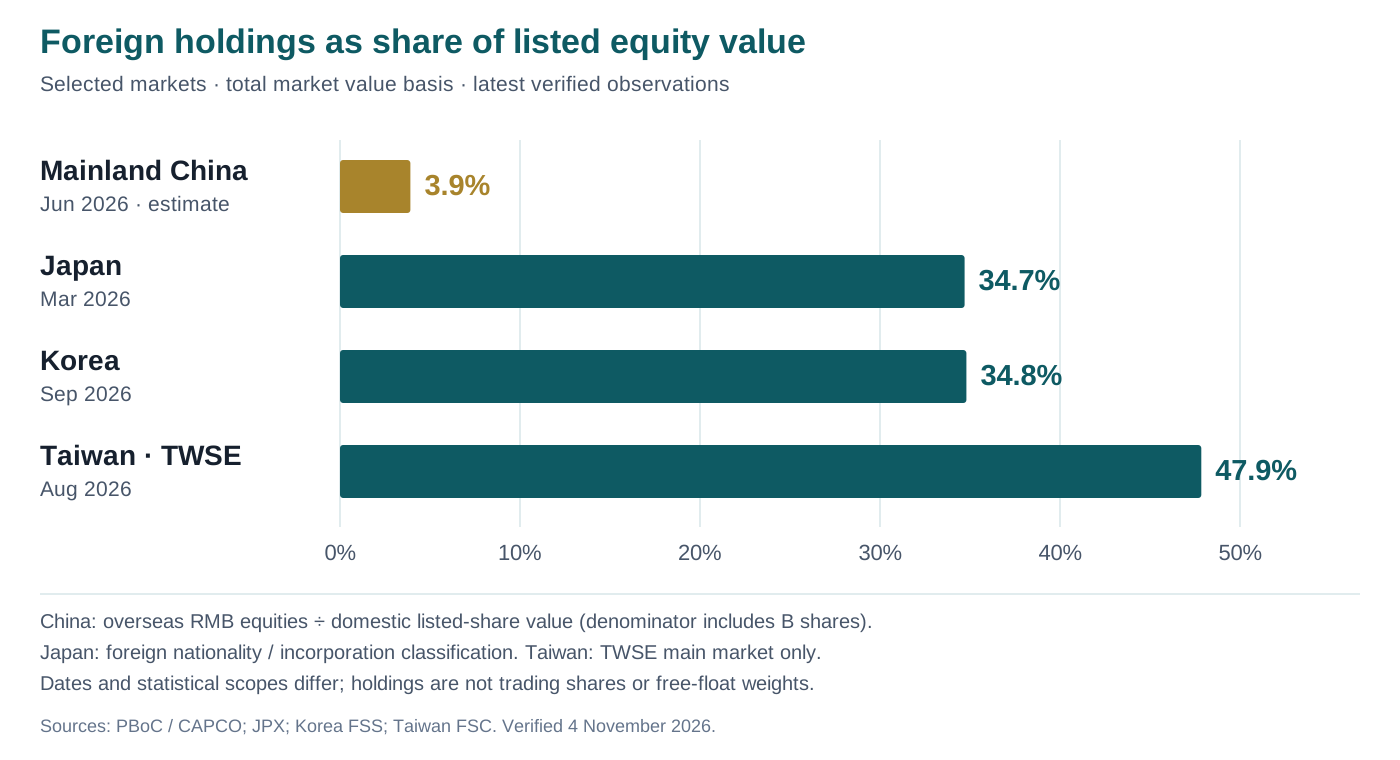
PBoC / CAPCO; JPX; Korea FSS; Taiwan FSC. Dates and market coverage shown in chart.
A–H premiums show that access does not eliminate segmentation
Same company · two trading lines · prices compared in a common currency
| What we observe | Why the gap can persist |
|---|---|
| A and H prices can differ | Investor demand, liquidity and required returns differ |
| Connect broadens access | The shares remain generally nonconvertible |
| A cheaper H share may attract investors | Borrowing, funding and price-convergence risks remain |
Greater access can narrow price gaps without making the two markets identical.
SFC Practice Note 25; HKEX market-access rules.
Which financing route fits this technology company?
| Company situation | Decision to make |
|---|---|
| Growing Chinese technology business; substantial R&D spending | Needs new equity to finance expansion |
| International sales are growing; founders value control | Weigh the investor base, governance and financing needs |
| Business may involve regulated activities | Establish eligibility and the operating structure before choosing a route |
Discussion · 6 minutes
Would you recommend a mainland, Hong Kong or U.S. listing? Identify the strongest benefit, the main risk, and one company fact that would change your choice.Session 4 · 45 minutes
Why has growth translated poorly into shareholder returns?
Return evidence, listed-company selection, cash flows, valuation and market information
Recent long-horizon returns also show a gap
Annualised USD net total returns · periods ending 30 September 2026 · % per year
MSCI China A covers eligible mainland large/mid caps; MSCI China spans several listing venues.
MSCI factsheets, 30 September 2026. Net total returns; China A pre-launch history is backtested.
Real A-share wealth barely grew in the 2000–2018 sample
Research case · Allen, Qian, Shan & Zhu · Journal of Finance, 2024
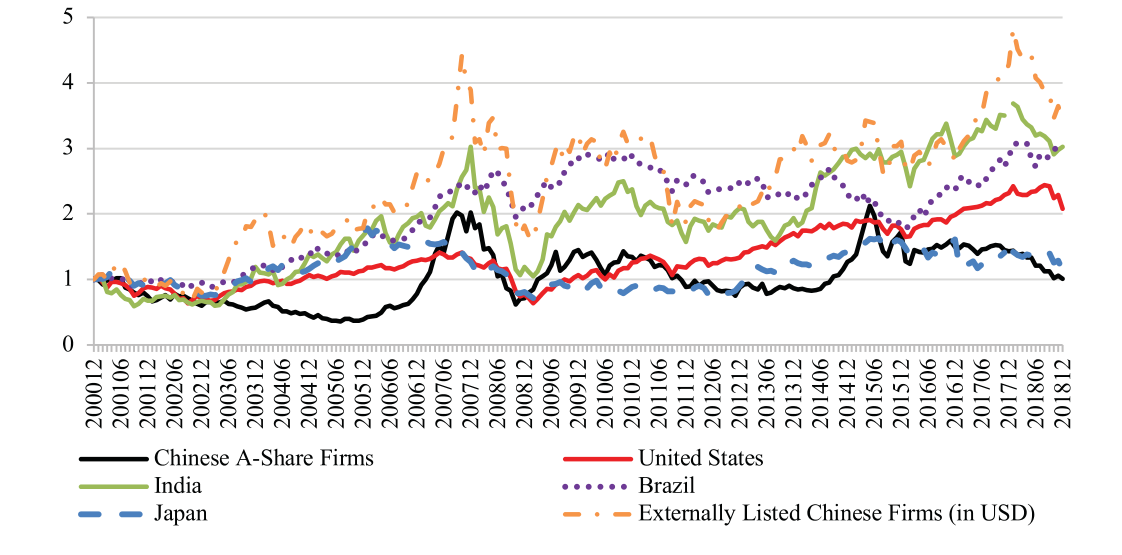
A-share portfolio: RMB 1 → RMB 1.01 in real terms, including cash dividends.
Allen et al. (2024), Figure 1, pp. 1005–1006. Real local-currency returns; external Chinese firms shown in USD.
Three links connect economic growth to shareholder returns
For a profitable company: price = earnings per share × P/E.
EPS doubles; P/E halves → the share price is unchanged. Dividends add to the investor’s return.
Teaching framework; Allen et al. (2024); valuation identity from Session 1.
Listing rules influence which firms investors can own
In the study, average A-share ROA fell from 13% in the year before IPO to 6% in the year after.
An economy’s best growth opportunities need not match the firms or weights in a listed portfolio.
Allen et al. (2024), pp. 1021–1022 and Table V.
Investment growth must produce cash flows for shareholders
| Evidence from Allen et al. | Interpretation |
|---|---|
| A-share firms invested more relative to assets than foreign comparison firms | More investment can expand the business without ensuring an adequate return |
| Net cash flow was lower, especially among large firms | Operating cash generation after investment was weaker in these comparisons |
| Matched unlisted Chinese manufacturers had stronger net cash flow | Weak listed-firm outcomes cannot be attributed only to the national economy |
Operating earnings before depreciation, less working-capital needs, taxes and capital expenditure; scaled by assets.
Allen et al. (2024), Tables VII and VIII; sample and matching details in the paper.
China’s relative valuation premium became a discount
Bekaert, Ke, Wang & Xiaoyan Zhang · December 2022 working paper · 1995–2018 data
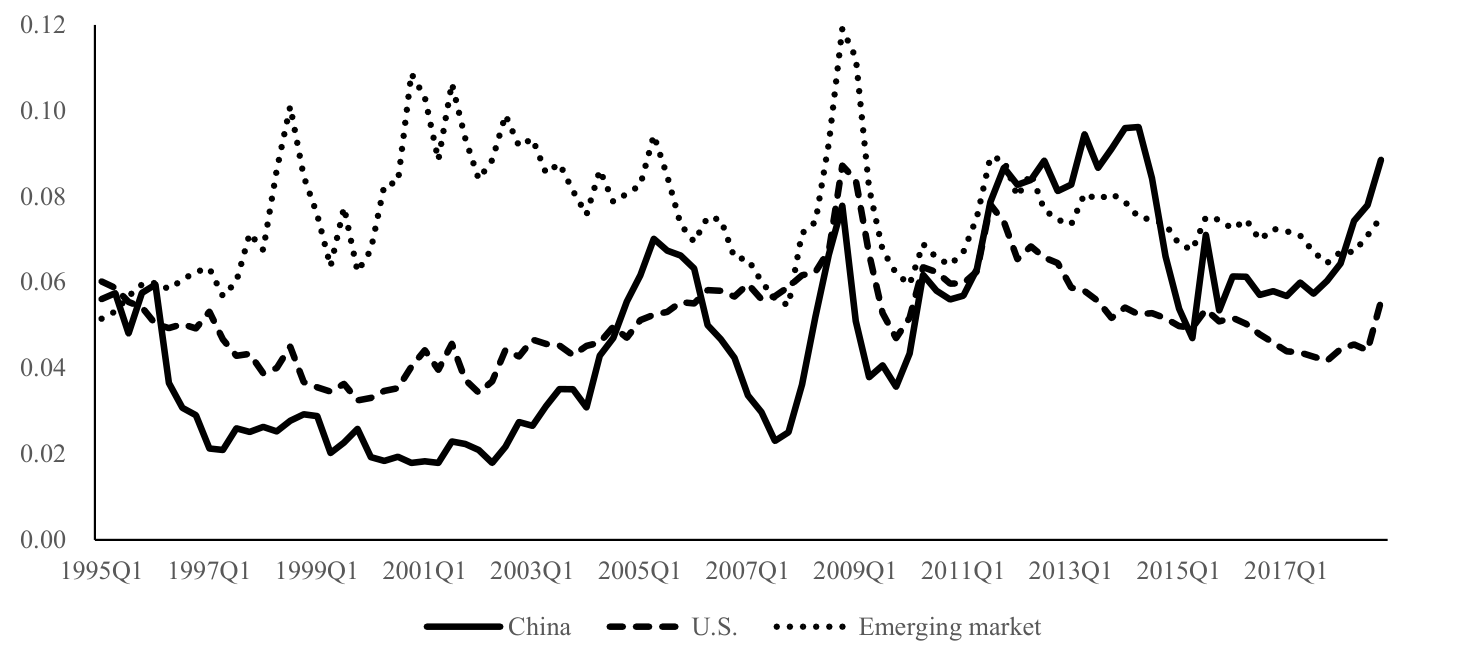
Earnings yield = E/P. Higher E/P means a lower P/E valuation; 0.06 = 6%.
Bekaert, Ke, Wang & Zhang, The China–U.S. Equity Valuation Gap (December 2022 working paper), Figure 1.
Speculative resale demand can amplify valuation swings
| Evidence | What it adds |
|---|---|
| Chinese put warrants · 2005–2008 | Almost worthless at expiry, yet heavily traded at inflated prices |
| Retail trading · 2016–2019 | Small-account estimated trading contribution: −5.61% annually; largest group near zero after costs |
| Stocks versus Bitcoin or art | Stocks carry claims on business cash flows; resale demand can still dominate particular episodes |
Scheinkman & Xiong (2003), JPE; Xiong & Yu (2011), AER; Jones et al. (2025), Table 8A.
A-share prices became informative about future profits
Jennifer Carpenter, Fangzhou Lu & Robert Whitelaw · JFE, 2021
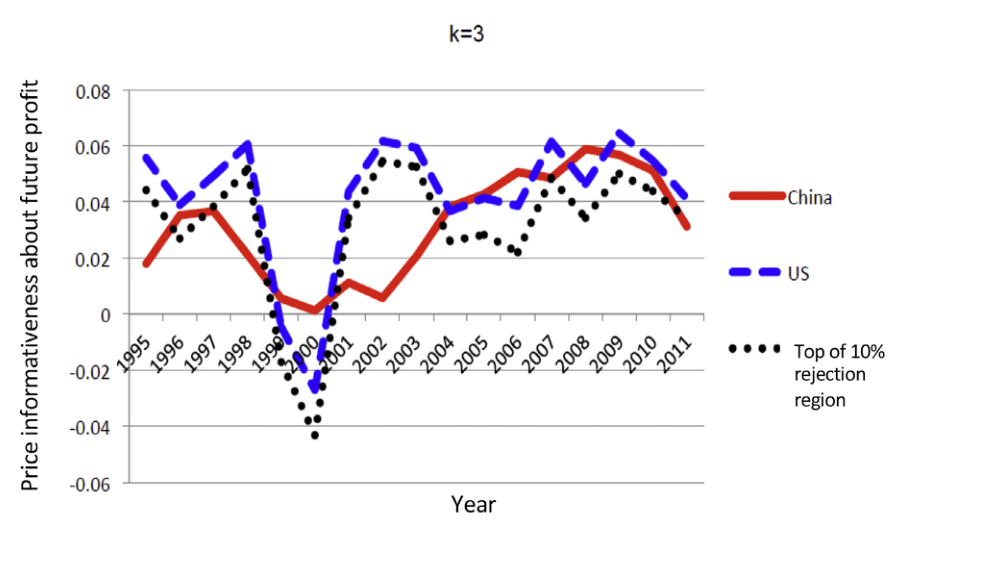
Higher values mean prices explain more variation in future profits. The vertical axis is not a stock return.
Carpenter, Lu & Whitelaw (2021), Figure 2, three-year forecast horizon; Figure 5 for ownership differences.
The evidence points to weak transmission from growth to shareholder wealth
| Link in the explanation | What the evidence supports |
|---|---|
| Economy → listed portfolio | Admission and overseas listing select different firms; large firms dominate value-weighted returns |
| Corporate expansion → cash for shareholders | Investment can grow faster than the cash it generates; governance affects outside shareholders |
| Earnings → market return | High starting valuations, speculative demand and later repricing can offset earnings growth |
| Market return → investor experience | Trading choices and costs can further reduce investors’ gains |
Prices can still convey useful information about future profits throughout this process.
Synthesis: Allen et al. (2024); Bekaert et al. (2022 WP); Jones et al. (2025); Carpenter et al. (2021).
What would make economic growth more rewarding for shareholders?
| Possible action | Connection to the evidence |
|---|---|
| Broaden access for productive growth firms | Improve the listed opportunity set |
| Strengthen governance and capital allocation | Improve the return on reinvestment and shareholder distributions |
| Improve disclosure and investor decision-making | Support valuation and reduce costly trading |
Discussion · 6 minutes
Choose one action. Explain which link it improves, what result would show progress, and why higher share prices alone would be an incomplete measure of success.Implications: follow per-share value, valuation and investor costs
| For investors | For market reform |
|---|---|
| Evaluate the businesses and weights you actually own | Admission and exit should improve the listed opportunity set |
| Ask whether reinvestment raises future cash per share | Governance should reward productive investment and protect shareholder claims |
| Assess today’s price against future earnings and distributions | Judge progress through operating and shareholder outcomes, alongside financing raised |
| Manage turnover, fees and concentration | Support disclosure, enforcement and informed investment decisions |
Economic growth rewards shareholders when productive businesses are investable, growth creates value per share, and the purchase price leaves room for a return.
Implications drawn from the session’s evidence and the valuation framework.
Before next class
Mishkin & Eakins: Chapters 17–19, banking institutions and bank management.
Compare Allen et al. (2024) with Carpenter et al. (2021). Choose one Xiaoyan Zhang coauthored paper: valuation gaps or retail trading.
Next meetings: 9 and 12 November · Banks
References · institutions and market measurement
- Mishkin & Eakins (2018), Financial Markets and Institutions, Ch. 13.
- Amstad, Sun & Xiong, eds. (2020), Handbook of China’s Financial System, Ch. 11.
- Carpenter & Whitelaw (2017), Annual Review of Financial Economics 9, 233–257.
- CAPCO: September 2026 market statistics; SSE and SZSE Trading Rules effective 6 July 2026.
- CSRC: registration rollout (2023), IPO pace (2023), delisting and implementation guidance (2024).
- HKEX Annual Report 2025; Hong Kong FSTB estimates tables (2026–27); Stock Connect guidance.
- SFC Practice Note 25 (2023); SEC depositary-receipt, VIE and HFCAA guidance; PCAOB (2025).
- Alibaba: 2024 listing and Connect announcements; FY2026 annual report and investor FAQ.
- MSCI: China A and China USD net-total-return factsheets, 30 September 2026.
- Hang Seng Indexes: A/H Premium factsheet, 30 April 2026; S&P DJI index methodology.
- Tesla FY2025 Form10-K; Toyota FY2024–26 financial summaries; BYD FY2025 annual report and dividend announcements.
- HKEX Listing Committee Report2025; Nasdaq/NYSE continued-listing rules; Choice IPO report,12October2026.
- Lee, Qu & Shen (2017), VoxChina: historical IPO/reverse-merger figure.
References · research for the performance case
- Allen, F., J. Qian, C. Shan & J. L. Zhu (2024). Dissecting the Long-Term Performance of the Chinese Stock Market. Journal of Finance 79(2), 993–1054.
- Carpenter, J. N., F. Lu & R. F. Whitelaw (2021). The real value of China’s stock market. Journal of Financial Economics 139(3), 679–696.
- Goldstein, I., B. Liu & L. Yang (2026). Market feedback: Evidence from the horse’s mouth. Journal of Financial Economics 180, 104255.
- Hansman, C., H. Hong, W. Jiang, Y.-J. Liu & J.-J. Meng (2025). Effects of Credit Expansions on Stock Market Booms and Busts. Review of Financial Studies 38(5), 1502–1544.
- Jones, C. M., D. Shi, X. Zhang & X. Zhang (2025). Retail Trading and Return Predictability in China. JFQA 60(1), 68–104.
- Lee, C. M. C., Y. Qu & T. Shen (2023). Gate Fees: The Pervasive Effect of IPO Restrictions on Chinese Equity Markets. Review of Finance 27(3), 809–849.
- Qian, Y., J. R. Ritter & X. Shao (2024). Initial Public Offerings Chinese Style. JFQA 59(1), 1–38.
- Bekaert, G., S. Ke, X. Wang & X. Zhang (December 2022). The China–U.S. Equity Valuation Gap. Working paper.
- Liao, L., B. Liu & H. Wang (2014). China’s secondary privatization: Perspectives from the Split-Share Structure Reform. JFE113(3),500–518.
Appendix
Optional reference pages
Valuation, measurement and research interpretation
Appendix: the finite-horizon dividend model
\[P_0=\sum_{t=1}^{T}\frac{E[D_t]}{(1+k_e)^t}+\frac{E[P_T]}{(1+k_e)^T}\]
\[P_T=\frac{D_{T+1}}{k_e-g}\quad\text{when a constant-growth terminal model is appropriate}\]
| Input | How to interpret it |
|---|---|
| Early cash flows | Forecast business performance, reinvestment and payout |
| Required return | Use the risk framework; assess estimation uncertainty |
| Terminal growth | Use a sustainable long-run rate below the required return |
| Terminal value | A model assumption, not a directly observed future sale price |
Mishkin & Eakins, Ch. 13.
Appendix: ratios that need a stated denominator
| Measure | Definition | Common confusion |
|---|---|---|
| A premium over H | A / FX-adjusted H − 1 | Different from H discount relative to A |
| H discount relative to A | 1 − FX-adjusted H / A | Uses A as the denominator |
| Index weight | Chosen share of portfolio value | Share price and company market value differ |
| Market capitalisation | Share price × outstanding shares | Growth includes new shares and new listings |
| Annualised compound return | Ending wealth / starting wealth, raised to 1/years, minus 1 | Different from the arithmetic mean of annual returns |
Appendix: aggregate growth and per-share growth
\[EPS=\frac{\text{Net income}}{\text{Shares outstanding}}\]
| Hypothetical company | Initial year | Later year |
|---|---|---|
| Net income | 100 | 120 |
| Shares outstanding | 100 | 150 |
| Earnings per share | 1.00 | 0.80 |
New shares can finance valuable assets. Evaluate the proceeds, issue price and subsequent cash flows.
Market expansion becomes shareholder value when existing claims benefit from the capital raised.
Appendix: firms report learning from stock prices
Goldstein, Liu & Yang · Journal of Financial Economics, 2026 · surveys in 2019 and 2022
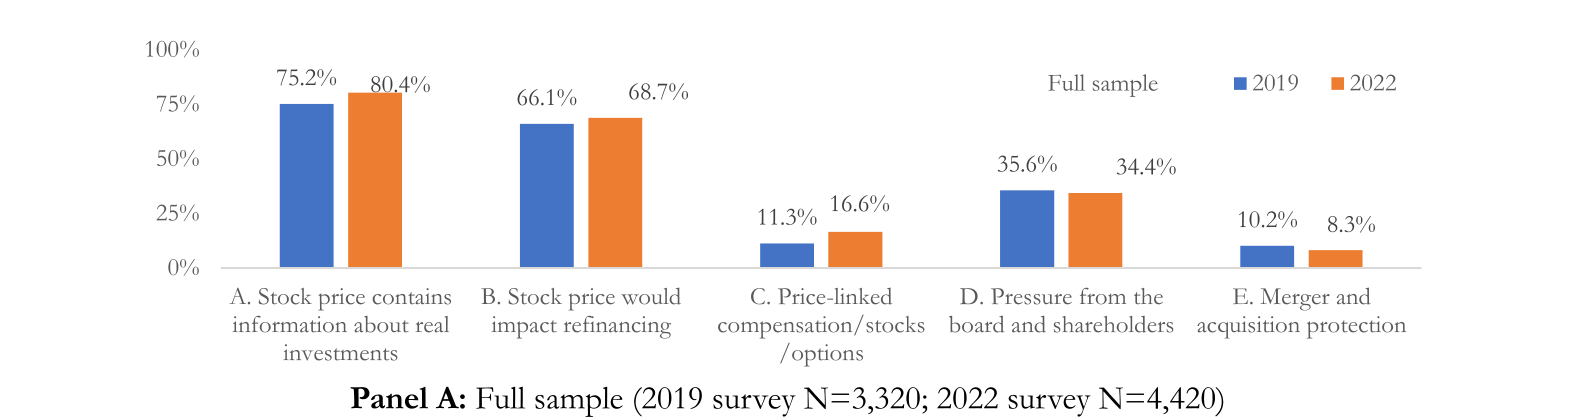
2022 learning response: 80.4% of 4,420 firms answering the motivation question. Multiple answers allowed.
Goldstein, Liu & Yang (2026), Figure 3A; Carpenter, Lu & Whitelaw (2021).
Appendix: credit availability and market cycles
Hansman et al. (RFS 2025): margin-lending expansion in 2010–15 raised affected stock prices; institutions anticipated the effect.
Hansman et al. (2025), Review of Financial Studies 38(5),1502–1544.
Appendix: measuring historical cash-dividend payout
\[p_y=\frac{\text{ordinary cash dividends attributed to profit year }y}{\text{earnings attributable to ordinary shareholders in year }y}\]
| Company | Financial-year ends | Cash-dividend payout history |
|---|---|---|
| Tesla | December 2023 / 2024 / 2025 | 0% / 0% / 0% |
| Toyota | March 2024 / 2025 / 2026 | 20.4% / 25.0% / 32.1% |
| BYD | December 2023 / 2024 / 2025 | 30.0% / 30.0% / 10.0% |
RMB 3.264bn cash dividend ÷ RMB 32.619bn attributable profit ≈10.0%.
Match dividends to the profit year. Adjust per-share comparisons for stock splits; identify buybacks separately.
Company annual reports, financial summaries and profit-year distribution disclosures; ratios rounded.
Appendix: reverse valuation and sensitivity
\[M_0=p_H\sum_{t=1}^{10}q^t+\frac{p_T(1+g_T)}{k-g_T}q^{10},\qquad q=\frac{1+g_H}{1+k}\]
M₀ = trailing P/E; gH = first-stage EPS growth; k = required return; pH / pT = early / mature payout. Early payouts: 0% / 32% / 10%; mature growth gT = 3%.
Vary required return; mature payout 70%
| k | Tesla | Toyota | BYD |
|---|---|---|---|
| 8% | 52.0% | 0.2% | 9.1% |
| 10% | 60.1% | 5.0% | 14.8% |
| 12% | 67.2% | 9.2% | 19.7% |
Vary mature payout; required return 10%
| pT | Tesla | Toyota | BYD |
|---|---|---|---|
| 50% | 65.6% | 8.0% | 18.5% |
| 70% | 60.1% | 5.0% | 14.8% |
| 90% | 56.1% | 2.8% | 12.0% |
Entries are annual EPS growth in years 1–10. Only the terminal growth rate must stay below the required return.
Author calculations from the stated dividend model; observed P/Es are the rounded 30 October 2026 inputs.
Appendix: market value by board
Domestic listed-share market value · 30 September 2026 · RMB trillion
The two Main Boards account for about two-thirds of domestic listed-share value.
China Association for Public Companies, September 2026 statistical report, Table 5-1.
Appendix: A-share trading rules
| Rule | Mainland A-share cash market | Implication |
|---|---|---|
| Resale | Newly bought shares generally cannot be sold the same day | Intraday reversal is constrained |
| Usual daily price limit | Main Boards: 10%; STAR and ChiNext: 20% | A limit restricts daily movement; losses can continue over several days |
| IPO exception | No daily limit in the first five trading days on these boards | Issue pricing and aftermarket price discovery are distinct |
| Short selling | Requires permitted access, eligible securities and available borrowing | A high valuation can be difficult to trade against |
SSE and SZSE Trading Rules, effective 6 July 2026.
Appendix: recent IPO counts
New mainland IPO companies · full calendar years
2025: 78 → 2026: 123. Of the 2026 total, 62 listed on the Beijing Stock Exchange.
China Association for Public Companies, September 2026 statistical report, Table 8-1.