Week 8 · Module 5
Banks: Management and Regulation
Financial Institutions and Markets · MF50004.01
Prof. Jiajun Jiang · Fudan University · 9 and 12 November 2026
From shareholder value to a bank’s balance sheet
Banks provide liquid claims to customers while financing assets that are often longer-term and harder to sell.
Four questions organise the week
| Session | Question |
|---|---|
| 1 · Bank management | How can a bank earn a return while meeting payments and absorbing losses? |
| 2 · Regulation | Which vulnerabilities do capital, liquidity and supervision address? |
| 3 · China’s banking business | How do ownership, customers and funding shape earnings and risk? |
| 4 · Repair and reform | How should China combine recapitalisation, consolidation and exit? |
Read both sides of the bank balance sheet
| Assets: uses of funds | Liabilities and equity: funding |
|---|---|
| Cash and central-bank balances · 10 | Customer deposits · 80 |
| Securities · 20 | Wholesale borrowing · 10 |
| Loans, net of allowances · 65 | Common equity · 10 |
| Other assets · 5 | Total · 100 |
Assets 100 = liabilities 90 + equity 10.
Mishkin & Eakins, Ch. 17; teaching example where indicated.
Lending creates a deposit; payments create a funding need
Hypothetical loan and interbank payment, with other entries unchanged.
Bank of England, Money creation in the modern economy (2014); hypothetical entries.
A current U.S. balance sheet shows the scale of transformation
Federal Reserve H.8, Table 3; 28 October 2026, not seasonally adjusted.
Four management decisions must fit together
| Decision | Manager’s question |
|---|---|
| Liquidity | Can we meet payments under stress? |
| Assets | Which loans and securities earn enough for their risks? |
| Funding | How stable and expensive are deposits and market borrowing? |
| Capital | How much loss can we absorb while continuing to operate? |
Mishkin & Eakins, Ch. 17; teaching example where indicated.
A deposit outflow changes liquidity before it changes equity
| Hypothetical starting bank | After a deposit withdrawal of 8 |
|---|---|
| Cash 10; securities 20; loans 65; other 5 | Cash 2; other assets unchanged |
| Deposits 80; borrowing 10; equity 10 | Deposits 72; borrowing 10; equity 10 |
| Assets = funding = 100 | Assets = funding = 92 |
Borrow against collateral · sell assets · attract funding · slow new lending
Mishkin & Eakins, Ch. 17; teaching example where indicated.
Credit management connects approval, monitoring and recovery
Many individually plausible loans can share the same property, industry or local-government exposure.
Mishkin & Eakins, Ch. 17; teaching example where indicated.
Rate changes affect both earnings and economic value
| Channel | Hypothetical exposure | Effect of higher rates |
|---|---|---|
| Repricing income | Rate-sensitive assets 40; liabilities 60 | +1 percentage point → annual net interest income −0.20 |
| Economic value | Longer-duration assets than liabilities | Asset values can fall more than liability values |
| Customer behaviour | Depositors can move into better-paying products | Funding costs may rise faster than expected |
The income example assumes immediate parallel repricing and fixed balances.
Mishkin & Eakins, Ch. 17; teaching example where indicated.
Equity determines how far an asset loss can be absorbed
Hypothetical banks: assets 100; identical asset loss of 5; liabilities unchanged.
Mishkin & Eakins, Ch. 17; teaching example where indicated.
Follow income through to the return on equity
| Hypothetical annual income statement | Amount |
|---|---|
| Interest income − interest expense | 4.0 − 2.0 = 2.0 |
| Add net fees; subtract operating costs | +0.6 − 1.0 |
| Subtract provision expense and tax | −0.4 − 0.3 |
| Net profit | 0.9 |
Average assets 100; average equity 10; average earning assets 90.
ROA = 0.9%; ROE = 9%; NIM = 2 / 90 = 2.22%.
Mishkin & Eakins, Ch. 17; teaching example where indicated.
A provision recognises a loss before the final write-off
| Stage | Simplified accounting effect |
|---|---|
| Expected loss rises by 2 | Provision expense +2; profit and equity fall by 2 before tax |
| Loan allowance increases | Gross loan stays recorded; net loan value falls |
| Later write off 2 already fully provided | Gross loan and allowance both fall; no new loss from that portion |
Do the allowance and reported profit reflect the borrower’s actual condition?
Mishkin & Eakins, Ch. 17; teaching example where indicated.
Fees and contingent commitments change the risk mix
| Activity | Income opportunity | Exposure to manage |
|---|---|---|
| Payment and advisory services | Fees | Operational, conduct and reputation risk |
| Credit line or guarantee | Commitment or guarantee fees | Future funding needs and borrower default |
| Loan sale or securitisation | Origination and servicing fees | Retained exposure, servicing and underwriting incentives |
| Derivatives | Hedging and client revenues | Counterparty, market and liquidity risk |
Mishkin & Eakins, Ch. 17; teaching example where indicated.
Would you approve this loan expansion?
| Hypothetical proposal | Constraint |
|---|---|
| Add 10 of long-term loans | Fund with short-term wholesale borrowing |
| Annual incremental interest income 0.60 | Funding cost 0.35; expected credit losses 0.15 |
| Before overhead and tax: surplus 0.10 | Limited spare capital; concentrated industry exposure |
Discussion · 6 minutes
Approve, modify or reject? Identify the most important constraint and a change that would improve the proposal.Session 2 · 45 minutes
Why banks need several kinds of regulation
Capital absorbs losses; liquidity meets payments; supervision tests the business behind the ratios.
Bank distress imposes costs beyond its shareholders
Preserve critical financial services while assigning losses and limiting incentives to take excessive risk.
Mishkin & Eakins, Ch. 17; teaching example where indicated.
Capital requirements distinguish the quality of loss absorption
| Basel baseline | Minimum ratio to risk-weighted assets |
|---|---|
| Common Equity Tier 1: highest-quality going-concern capital | 4.5% |
| Tier 1: CET1 plus eligible additional instruments | 6.0% |
| Total capital: Tier 1 plus eligible Tier 2 | 8.0% |
| Capital conservation buffer, held in CET1 | Additional 2.5% |
Jurisdictional, countercyclical and systemic-bank requirements can add to these baselines.
Basel Framework, capital definitions and minimum requirements; national rules add requirements.
Risk weights and leverage limits address different weaknesses
| Hypothetical bank | Calculation |
|---|---|
| Assets: cash 10, government securities 30, corporate loans 60 | Illustrative weights: 0%, 0%, 100% |
| CET1 capital: 8 | RWA = 60; CET1 ratio = 13.3% |
| Simplified exposure measure: 100 | Capital / exposure = 8.0% |
| Add 40 of zero-weight assets financed with debt | RWA ratio unchanged; simple capital/exposure falls to 5.7% |
Illustration only: actual weights, regulatory adjustments and leverage exposures depend on the rules.
Basel Framework; hypothetical calculation.
Liquidity rules cover a short stress and a longer funding horizon
| Rule | Question | Core ratio |
|---|---|---|
| Liquidity Coverage Ratio (LCR) | Can the bank withstand 30 days of stressed net outflows? | High-quality liquid assets / net cash outflows ≥100% |
| Net Stable Funding Ratio (NSFR) | Does a one-year funding structure support the assets? | Available / required stable funding ≥100% |
A solvent bank needs payment capacity; a liquid bank still needs assets worth more than its obligations.
Basel Framework: LCR and NSFR.
Supervision tests how the bank measures and manages risk
A stress test translates a scenario into losses, funding needs and remaining capital.
Mishkin & Eakins, Ch. 18; Basel supervisory review principles.
Banks can meet a higher capital ratio by shrinking assets
The 2011 EBA exercise required selected banks to reach a 9% core Tier 1 ratio by June 2012.
| Research question | Evidence |
|---|---|
| How did affected banks respond relative to comparable banks? | Capital ratios rose mainly through lower risk-weighted assets |
| What happened to borrowers? | Corporate and retail lending contracted; dependent firms experienced weaker real outcomes |
| Policy implication | Assess how a ratio improves, alongside the reported improvement |
Gropp, Mosk, Ongena & Wix (2019), Review of Financial Studies 32(1), 266–299.
Bank structure reflects history, scale and competition
FDIC-insured commercial banks and savings institutions; historical and latest observations.
ROA 1.37% annualised · NIM 3.32% · quarterly net income US$90.1bn.
FDIC: 4,336 institutions at end-2025; 4,238 in Q2 2026.
Competition changes how banks fund and serve customers
| Change | Business-model consequence |
|---|---|
| Digital distribution | Lower servicing costs; easier deposit comparison and switching |
| Securities markets and nonbank lenders | Borrowers and savers gain alternatives |
| Bank groups and cross-border operations | Scale and product breadth; more complex supervision |
| Consolidation | Potential efficiencies alongside integration and concentration risks |
Mishkin & Eakins, Ch. 19; links to W04 and W05.
Credit Suisse: a business-model crisis became a funding crisis
| Reported position or event | Observation |
|---|---|
| Capital at end-2022 | CET1 ratio 14.1% |
| Liquidity in Q3 2022 | Average LCR 192% |
| Funding pressure in Q4 2022 | CHF138bn deposit withdrawals |
| 15 March 2023 | CHF13.2bn deposit outflow in one day |
| 19 March 2023 | UBS acquisition announced with official support |
FINMA, Lessons Learned from the CS Crisis (19 December 2023), pp. 56, 63–64.
Credit Suisse links governance, confidence and liquidity
FINMA, Lessons Learned from the CS Crisis (2023).
When should a supervisor intervene?
A major bank reports regulatory buffers but has repeated losses, control failures and accelerating client withdrawals.
Discussion · 6 minutes
Which intervention would you prioritise: stronger governance, additional capital, a funding plan or a restructuring partner? Explain the trigger for escalating further.Regulation works through several complementary defences
Session 3 · 45 minutes
How China’s banking structure shapes earnings and risk
Ownership, funding and customer mix determine how common pressures affect different banks.
China’s banks serve different customers and policy roles
| Institution group | Role and examples |
|---|---|
| Six large commercial banks | National deposit and lending networks: ICBC, ABC, BOC, CCB, Bank of Communications, Postal Savings Bank |
| National joint-stock banks | Commercial banking across regions; ownership structures differ |
| City and rural institutions | Local businesses, households and agriculture; greater geographic concentration |
| Private and foreign banks | Specialised models, digital lending or cross-border services |
| Policy and development institutions | Mandated financing; separate from commercial-bank performance aggregates |
NFRA institution classifications; Handbook of China’s Financial System, Ch. 1.
Large banks hold a substantial share of banking assets
Banking financial institutions · end-June 2026 · RMB trillion
NFRA, end-June 2026 balance-sheet statistics. Total assets: RMB498.0tn.
Ownership matters through incentives and business relationships
| Named example | Ownership structure | Question for analysis |
|---|---|---|
| Bank of China | Huijin is a controlling state shareholder; MOF also holds shares | How are owner objectives translated into lending and capital decisions? |
| China Minsheng Bank | Reports no controlling shareholder or actual controller | How do dispersed owners and the board monitor management? |
| Local city/rural banks | Ownership and local borrower relationships vary | How concentrated are lending and related-party exposures? |
BOC interim report (2026); Minsheng interim report (2025); Handbook, Ch. 1.
Funding and asset mix explain more than the bank label
| Balance-sheet question | Chinese banking context | U.S. comparison |
|---|---|---|
| What funds the bank? | Large customer-deposit franchises; competition for term savings | Deposits also dominate; mix varies sharply across banks |
| What earns the income? | Corporate and household loans plus a substantial securities book | Loans and securities; customer and product mix varies |
| Which links create concentration? | Local firms, property, infrastructure and public-sector relationships | Commercial property, sectors and concentrated depositor groups |
| What should we compare? | Funding stability, asset yield, credit cost and capital | Use the same measures before interpreting profitability |
China commercial banks, H1 2026: non-interest income = 23.65% of total income.
Original Lecture 10 comparison; Fed H.8; NFRA; Handbook, Ch. 1.
China’s net interest margin has narrowed
NFRA commercial-bank indicators: annual 2020–2025 and annualised H1 2026.
Asset yields and deposit costs adjust on different schedules
Earning assets 100 lose 0.30 in interest income; funding 90 saves 0.09 in interest cost → net interest income falls 0.21.
Teaching scenario; links to W05–W06.
Read asset quality together with profitability and capital
Commercial-bank NPL ratios by type · end-June 2026 · %
All commercial banks: ROA 0.58% · ROE 7.72% · total capital ratio 15.26%.
NFRA, H1/end-June 2026. Profitability annualised; capital and NPLs at period end.
Provision coverage depends on both losses and classification
| Hypothetical loan book | Amount / ratio |
|---|---|
| Gross loans | 100 |
| Nonperforming loans | 2 → NPL ratio 2% |
| Loan-loss allowance | 4 → provision coverage 200% |
| Newly identified problem loans raise NPLs to 4 | Coverage falls to 100% if allowance remains 4 |
The allowance is an accounting loss buffer; coverage is allowance divided by reported NPLs.
NFRA indicator definitions; hypothetical calculation.
Property and local debt connect borrowers to bank earnings
Replacing an LGFV claim with a government bond can reduce credit risk while changing the bank’s yield and capital use.
W06 local-debt analysis; bank balance-sheet implications.
Green credit combines a growth opportunity with underwriting
Green loans: RMB 49.22 trillion; reported year-on-year growth 13.0%.
| Instrument or decision | What the bank must evaluate |
|---|---|
| Project and equipment loans | Project revenue, technology and policy dependence |
| Green bonds and related services | Issuer credit, use of proceeds and disclosure |
| Environmental risk assessment | Physical risks, transition costs and borrower adaptation |
PBoC, Q3 2026 loan allocation report, reproduced by Heilongjiang financial authority.
How should a bank respond to a narrower margin?
| Management proposal | Possible consequence |
|---|---|
| Grow the loan book faster | More income volume; greater capital and credit exposure |
| Cut deposit rates and operating costs | Lower expenses; possible customer losses |
| Expand fees and specialised lending | Diversification; new conduct and underwriting risks |
| Retain more earnings | More internal capital; lower current shareholder distributions |
Discussion · 6 minutes
Choose two responses for a bank with limited spare capital and concentrated local lending. Explain one response you would avoid.Averages conceal different banking problems
Nationwide banks: scale, transmission and capital deployment.
Local banks: customer information, geographic concentration and owner incentives.
Across the system: narrower margins raise the value of efficient operations and sound credit decisions.
Session 4 · 45 minutes
How should weak bank balance sheets be repaired?
Recognise losses, restore capital and incentives, and keep essential services functioning.
Reforms changed bank incentives in stages
| Reform stage | Balance-sheet or incentive change |
|---|---|
| 1994: three policy banks established | Separate designated policy financing from commercial-bank business |
| 1999: four asset management companies established | Transfer and resolve legacy bad assets of the large banks |
| 2000s: recapitalisation, strategic investment and listings | Rebuild capital and introduce shareholder scrutiny |
| 2015: deposit-rate ceiling removed; deposit insurance introduced | Change funding competition and clarify depositor protection |
| 2024: revised capital rules take effect | More risk-sensitive measurement and proportional requirements |
Handbook of China’s Financial System, Ch. 1; NFRA capital rules (2024).
Different authorities address different parts of the problem
| Authority | Banking role |
|---|---|
| National Financial Regulatory Administration (NFRA) | Prudential supervision of banks and insurers; institutional and conduct oversight |
| People’s Bank of China (PBoC) | Monetary policy, macroprudential policy and financial stability functions |
| Ministry of Finance and public owners | Fiscal resources and state-capital responsibilities |
| Other market and foreign-exchange authorities | Securities and cross-border obligations within their mandates |
China’s revised capital rules, effective January 2024, use three regulatory groups based on size and cross-border complexity.
Chinese minimum CET1 ratio: 5%, plus the 2.5% conservation buffer and other applicable requirements.
NFRA and PBoC mandates; 2023 regulatory reorganisation.
The 2018 asset-management rules changed who bears investment losses
| Earlier friction | Reform direction |
|---|---|
| Expected principal protection on investment products | No promised principal or return guarantees in asset management |
| Pooled funding and maturity mismatch | Closer matching and separate product management |
| Layers of products obscured the final exposure | Limits on nesting and stronger look-through regulation |
| Smoothed returns hid investment risk | Net-asset-value measurement and disclosure |
PBoC, CBIRC, CSRC and SAFE, asset-management guidance (2018).
The location of an exposure does not determine its economic risk
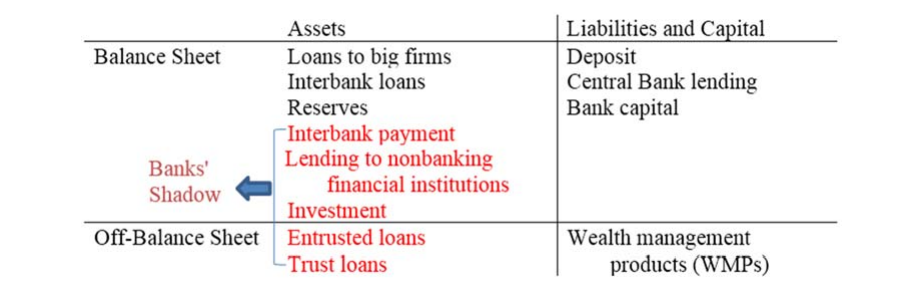
Guofeng Sun (2019), original “banks’ shadow” diagram; historical structure.
China’s large-bank recapitalisation supports lending capacity
Completed gross equity financing · 2025 · RMB billion
Total RMB520bn, including RMB500bn subscribed by the Ministry of Finance. 2026 announced ICBC and ABC plans: up to RMB260bn combined, separate from the completed 2025 financing.
Bank issuance reports; MOF; ICBC/ABC announcements and ABC Q3 2026 report.
Fresh equity creates headroom; loan growth uses it
| Hypothetical bank | CET1 / risk-weighted assets |
|---|---|
| Before injection | 10 / 100 = 10.0% |
| New common equity of 2, held temporarily in zero-weight cash | 12 / 100 = 12.0% |
| Then add 20 of 100%-weighted loans | 12 / 120 = 10.0% |
Which assets justify using the new loss-absorbing capacity?
Hypothetical capital example; excludes other regulatory adjustments.
Henan: 25 institutions became one rural commercial bank
Registered capital RMB29.25bn · 891 branches
Registered share capital describes the opening institution; it is not a measure of fresh cash injected.
NFRA Henan opening approval (24 February 2025); Henan legislature, opening on 26 February.
Loss recognition, capital and liquidity solve different problems
A merger combines balance sheets. It creates value only if the combined business and repair plan improve the outcome.
Bank resolution principles; link to W04 Baoshang case.
Support works better when it changes incentives
| Repair action | Condition that strengthens the outcome |
|---|---|
| Public equity | Clear valuation, owner accountability and performance objectives |
| Merger | Credible asset review and a funded integration plan |
| Bad-asset disposal | Transparent transfer values and explicit loss allocation |
| Temporary liquidity | Viable counterparty, appropriate collateral and a repayment plan |
Mishkin & Eakins, Ch. 18; China bank-reform analysis.
Design a repair package for a weak local bank
| Case-based hypothetical | Information available |
|---|---|
| Local loan concentration; reported losses may be incomplete | Large deposit franchise and useful payment network |
| Thin capital; limited private funding interest | A stronger regional bank could acquire it |
| Public funds are available but limited | Local firms still need working-capital loans |
Discussion · 6 minutes
Choose a sequence of actions. Who should absorb existing losses, what should public support fund, and what must change in the successor bank?The four questions lead to one banking assessment
| Question | Evidence to examine |
|---|---|
| Can the bank earn sustainably? | Margin, fees, costs and realistic credit-loss charges |
| Can it meet payments? | Funding concentration, liquid assets and collateral |
| Can it absorb losses? | Capital quality, exposure and stress outcomes |
| Will repair improve the next decision? | Ownership, governance, supervision and loss allocation |
Before next class
Mishkin & Eakins, Chapters 20–22: mutual funds, insurance and other nonbank institutions.
Next meetings: 16 and 19 November · Non-depository institutions
References: institutions, statistics and cases
| Source | Use in this lecture |
|---|---|
| Mishkin & Eakins, Chapters 17–19; Handbook of China’s Financial System, Ch. 1 | Bank management, regulation and Chinese institutions |
| Federal Reserve H.8; FDIC Quarterly Banking Profile | Current U.S. balance sheet, profitability and institution count |
| Basel Committee, Basel Framework | Capital, leverage, liquidity and supervision |
| FINMA, Lessons Learned from the CS Crisis (19 December 2023) | Credit Suisse case |
| NFRA statistical tables and regulatory releases | Chinese banking assets, margins, asset quality and capital |
| Ministry of Finance; recipient-bank filings; bank-restructuring approvals | Recapitalisation and local-bank case |
References: banking structure and capital allocation
| Source | Use in this lecture |
|---|---|
| Bank of England (2014), Money creation in the modern economy | Loan creation and interbank payment |
| Sun (2019), China’s shadow banking: Bank’s shadow and traditional shadow banking, BIS WP 822 | Original balance-sheet diagram |
| PBoC and partner regulators (2018), asset-management guidance | Risk allocation and regulatory perimeter |
| Choi, Escalante & Larsen (2020), Green Banking in China, CPI | Green instruments and historical loan performance |
| PBoC Q3 2026 loan allocation report | Current green-loan scale |
| Original Lecture 10; archived Chinese banking slides | Coverage and historical teaching figures |
Gropp, Mosk, Ongena & Wix (2019). Banks Response to Higher Capital Requirements. RFS 32(1), 266–299.
Appendix
Optional reference pages
Definitions, worked examples and original historical exhibits
Appendix: compare bank ratios using the right denominator
| Measure | Numerator | Denominator |
|---|---|---|
| ROA | Net profit | Average total assets |
| ROE | Net profit | Average equity |
| NIM | Net interest income | Average earning assets |
| NPL ratio | Nonperforming loans | Gross loans |
| Provision coverage | Loan-loss allowance | Nonperforming loans |
| CET1 ratio | Regulatory CET1 | Risk-weighted assets |
| Regulatory leverage ratio | Tier 1 capital | Regulatory exposure measure |
Mishkin; NFRA definitions; Basel Framework.
Appendix: the leverage and capital calculations
\[ROE=\frac{\text{Net profit}}{\overline{Equity}}=ROA\times\frac{\overline{Assets}}{\overline{Equity}}\]
| Illustration | Result |
|---|---|
| Profit 0.9; average assets 100; average equity 10 | ROA0.9%; equity multiplier10; ROE9% |
| Loss5; initial equity10 or4 | Remaining equity5 or−1 |
| CET1 rises10→12 with RWA100 | Ratio10%→12% |
| RWA then rises100→120 | Ratio returns to10% |
Hypothetical calculations.
Appendix: green-credit rules, pilots and instruments
| Development | Purpose |
|---|---|
| 2012 Green Credit Guidelines | Integrate environmental and social risks into bank lending |
| 2017 initial pilot areas in Zhejiang, Jiangxi, Guangdong, Guizhou and Xinjiang | Test local institutions, incentives and green-finance products |
| Credit products and related instruments | Project loans, equipment finance, bond financing and credit enhancement |
| Assessment | Borrower cash flows, environmental performance and risk-adjusted returns |
CBRC Green Credit Guidelines (2012); initial pilot announcement (2017); CPI (2020).
Appendix: historical green-loan performance
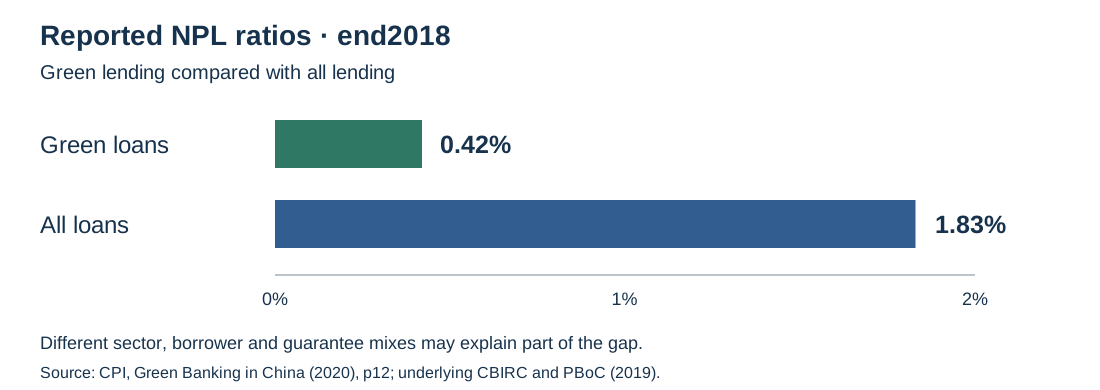
Choi, Escalante & Larsen (2020), Green Banking in China, p. 12; end-2018 observations.
Appendix: the original China–U.S. balance-sheet comparison
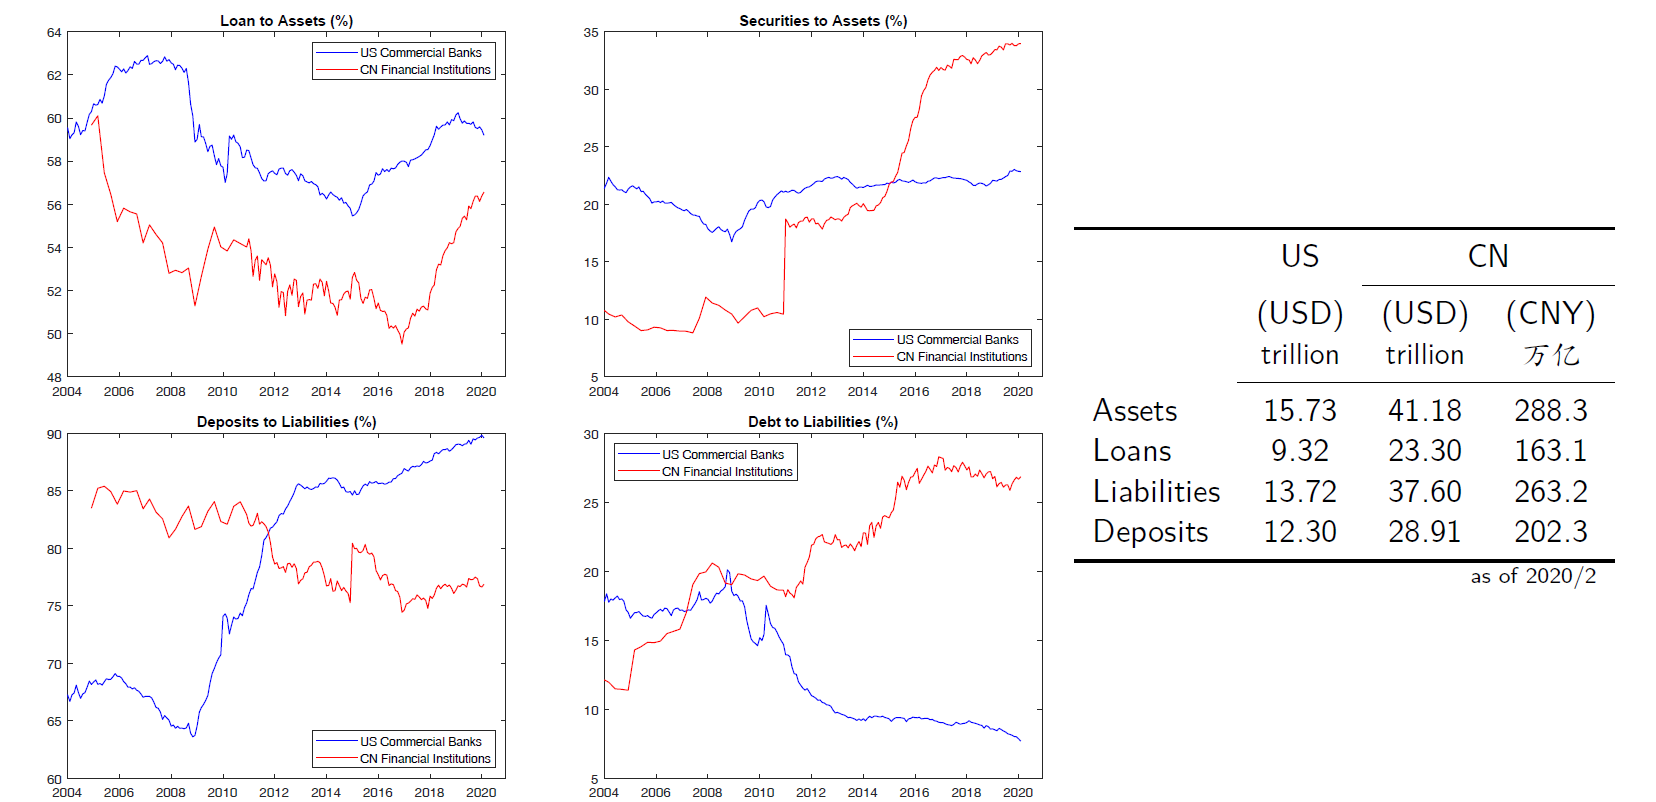
Jun Pan teaching graphic, reproduced in Lecture 10 (2024); historical series through 2019 and table dated February 2020.
Appendix: a bank-repair checklist
| Before a decision | Question |
|---|---|
| Asset review | What are realistic recoveries and unrecognised losses? |
| Liability map | Who has a claim, with what priority and protection? |
| Viability | Can the business generate earnings after realistic credit costs? |
| Funding | What cash is needed to preserve operations during repair? |
| Capital and ownership | Who invests, who absorbs losses and who controls the successor? |
| Follow-up | Which governance and lending practices will change? |
Teaching synthesis of the bank-management and resolution framework.
Appendix: how securitisation changes the funding chain
| Role or exposure | What remains to examine |
|---|---|
| Servicing | Who collects payments and handles arrears? |
| Retained interests or guarantees | Which losses can return to the bank? |
| Origination incentives | Does the lender still have incentives to screen borrowers? |
Mishkin & Eakins, Ch. 19; original Lecture 10.